IIFT International Business and Management Review Journal

Sanjaya Pudasaini1  and Rita Bhandari2
1Kathmandu University School of Management (KUSOM), Lalitpur, Bagmati, Nepal
2Public Administration Campus, Tribhuvan University, Kathmandu, Bagmati, Nepal

Creative Commons Non Commercial CC BY-NC: This article is distributed under the terms of the Creative Commons Attribution-NonCommercial 4.0 License (http://www.creativecommons.org/licenses/by-nc/4.0/) which permits non-Commercial use, reproduction and distribution of the work without further permission provided the original work is attributed.
This study examines the association between e-governance service quality and perceived business ease among small and medium-sized enterprises (SMEs) in Kathmandu, Nepal. Using a sequential explanatory mixed-methods design, the study first analysed survey data from 350 SME owners and managers and then conducted 30 semi-structured interviews to explain the quantitative findings. The quantitative results showed that system quality, information quality, administrative support quality and trust in digital government services were all positively associated with perceived business ease. Administrative support quality showed the strongest standardised association, suggesting that SMEs evaluate e-governance not only through platform access but also through the availability of procedural guidance, problem resolution and confirmation support. The qualitative findings reinforced this interpretation by showing that online services reduced routine burden but often remained incomplete when information was unclear, support was weak or digital records required manual verification. The study extends e-governance service-quality research by showing that SMEs assess digital government services through procedural completion rather than access alone. The study concludes that SME-facing e-governance should be assessed through a procedural completion logic rather than an access logic.
E-governance service quality, perceived business ease, small and medium-sized enterprises, administrative burden, procedural completion, Nepal
Aljukhadar, M., Belisle, J.-F., Dantas, D. C., Sénécal, S., & Titah, R. (2022). Measuring the service quality of governmental sites: Development and validation of the e-government service quality (EGSQUAL) scale. Electronic Commerce Research and Applications, 55, 101182. https://doi.org/10.1016/j.elerap.2022.101182
Alkraiji, A., & Ameen, N. (2022). The impact of service quality, trust and satisfaction on young citizen loyalty towards government e-services. Information Technology & People, 35(4), 1239–1270. https://doi.org/10.1108/ITP-04-2020-0229
Alsarraf, H. A., Aljazzaf, S., & Ashkanani, A. M. (2023). Do you see my effort? An investigation of the relationship between e-government service quality and trust in government. Transforming Government: People, Process and Policy, 17(1), 116–133. https://doi.org/10.1108/TG-05-2022-0066
Bahadur Giri, P., Raj Giri, U., Raj Giri, B., Giri, A., & Pokhrel, T. (2025). E-governance and service delivery in Nepal: Evidence from Nagarjun Municipality. International Journal of Managing Public Sector Information and Communication Technologies, 16(4), 1–14. https://doi.org/10.5121/ijmpict.2025.16401
Boateng, G. O., Neilands, T. B., Frongillo, E. A., Melgar-Quiñonez, H. R., & Young, S. L. (2018). Best practices for developing and validating scales for health, social, and behavioral research: A primer. Frontiers in Public Health, 6. https://doi.org/10.3389/fpubh.2018.00149
Braun, V., & Clarke, V. (2006). Using thematic analysis in psychology. Qualitative Research in Psychology, 3(2), 77–101. https://doi.org/10.1191/1478088706qp063oa
Braun, V., & Clarke, V. (2023). Toward good practice in thematic analysis: Avoiding common problems and be(com)ing a knowing researcher. International Journal of Transgender Health, 24(1), 1–6. https://doi.org/10.1080/26895269.2022.2129597
Creswell, J. W., & Plano Clark, V. L. (2018). Designing and conducting mixed methods research (3rd ed.). Sage Publications.
Das, A., & Das, S. S. (2022). E-government and entrepreneurship: Online government services and the ease of starting business. Information Systems Frontiers, 24(3), 1027–1039. https://doi.org/10.1007/s10796-021-10121-z
DeLone, W. H., & McLean, E. R. (2003). The DeLone and McLean model of information systems success: A ten-year update. Journal of Management Information Systems, 19(4), 9–30. https://doi.org/10.1080/07421222.2003.11045748
Fetters, M. D., Curry, L. A., & Creswell, J. W. (2013). Achieving integration in mixed methods designs—principles and practices. Health Services Research, 48(6pt2), 2134–2156. https://doi.org/10.1111/1475-6773.12117
Guetterman, T. C., Fetters, M. D., & Creswell, J. W. (2015). Integrating quantitative and qualitative results in health science mixed methods research through joint displays. The Annals of Family Medicine, 13(6), 554–561. https://doi.org/10.1370/afm.1865
Haynes-Brown, T. K. (2023). Using theoretical models in mixed methods research: An example from an explanatory sequential mixed methods study exploring teachers’ beliefs and use of technology. Journal of Mixed Methods Research, 17(3), 243–263. https://doi.org/10.1177/15586898221094970
Ivankova, N. V., Creswell, J. W., & Stick, S. L. (2006). Using mixed-methods sequential explanatory design: From theory to practice. Field Methods, 18(1), 3–20. https://doi.org/10.1177/1525822X05282260
Li, Y., & Shang, H. (2023). How does e-government use affect citizens’ trust in government? Empirical evidence from China. Information & Management, 60(7), 103844. https://doi.org/10.1016/j.im.2023.103844
Madsen, C. Ø., Lindgren, I., & Melin, U. (2022). The accidental caseworker—How digital self-service influences citizens’ administrative burden. Government Information Quarterly, 39(1), 101653. https://doi.org/10.1016/j.giq.2021.101653
Martins, J., & Veiga, L. G. (2022). Digital government as a business facilitator. Information Economics and Policy, 60, 100990. https://doi.org/10.1016/j.infoecopol.2022.100990
Ministry of Communication and Information Technology. (2019). Digital Nepal framework: Unlocking Nepal’s growth potential.
Moynihan, D., Herd, P., & Harvey, H. (2015). Administrative burden: Learning, psychological, and compliance costs in citizen-state interactions. Journal of Public Administration Research and Theory, 25(1), 43–69. https://doi.org/10.1093/jopart/muu009
Papadomichelaki, X., & Mentzas, G. (2012). e-GovQual: A multiple-item scale for assessing e-government service quality. Government Information Quarterly, 29(1), 98–109. https://doi.org/10.1016/j.giq.2011.08.011
Pham, L., Limbu, Y. B., Le, M. T. T., & Nguyen, N. L. (2023). E-government service quality, perceived value, satisfaction, and loyalty: Evidence from a newly emerging country. Journal of Public Policy, 43(4), 812–833. https://doi.org/10.1017/S0143814X23000296
Scutella, M., Plewa, C., & Reaiche, C. (2024). Small businesses and e-government participation: The role of personalisation preference and intermediaries. Internet Research, 34(3), 917–938. https://doi.org/10.1108/INTR-02-2021-0107
Wang, Y.-S., & Liao, Y.-W. (2008). Assessing eGovernment systems success: A validation of the DeLone and McLean model of information systems success. Government Information Quarterly, 25(4), 717–733. https://doi.org/10.1016/j.giq.2007.06.002
Appendix A
Table A1. Detailed Online Government Service Use Among Small and Medium-sized Enterprises.
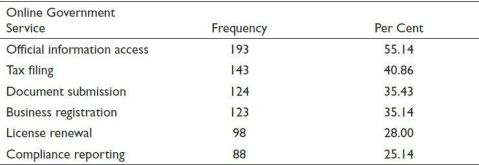
Table A2. Item-level Descriptive Statistics and Reliability Diagnostics.
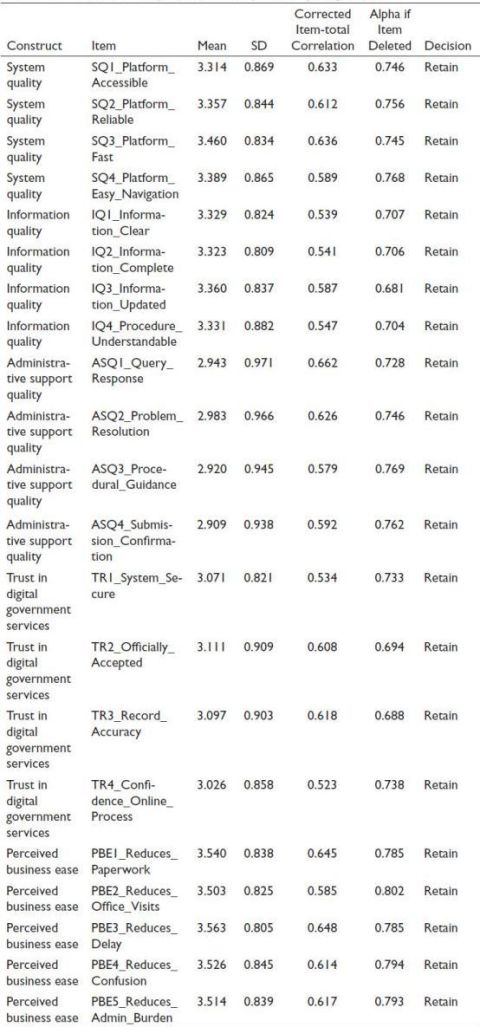
Table A3. Exploratory Factor Analysis Loading Diagnostics.
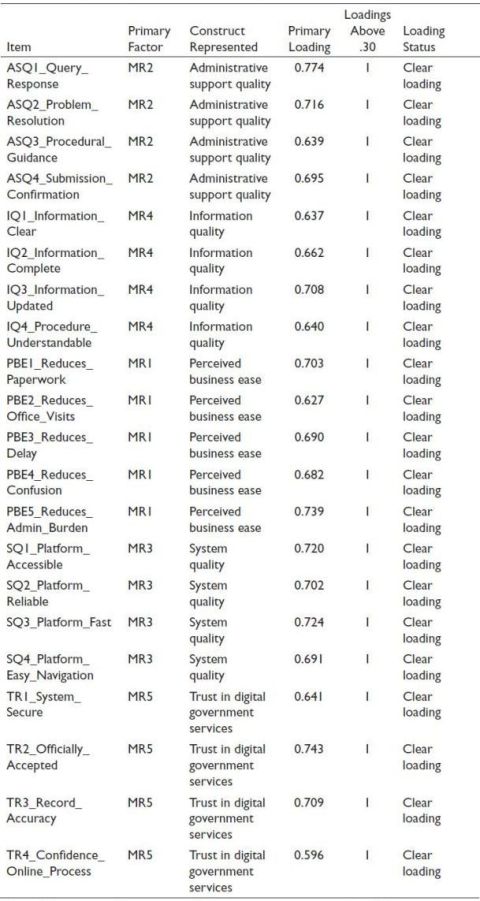
Note: MR1 = perceived business ease; MR2 = administrative support quality; MR3 = system quality; MR4 = information quality; MR5 = trust in digital government services.
Table A4. Confirmatory Factor Analysis Results.
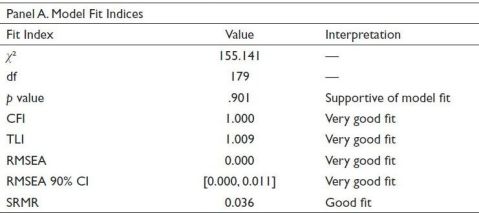
Notes: CFA was estimated using the WLSMV estimator for five-point Likert-scale items. The fit indices indicate very good model fit, but they are interpreted cautiously alongside factor loadings, composite reliability and average variance extracted. AVE: Average variance extracted; CFI: Comparative fit index; CR: Composite reliability; RMSEA: Root mean square error of approximation; SRMR: Standardised root mean square residual; TLI: Tucker–Lewis index.
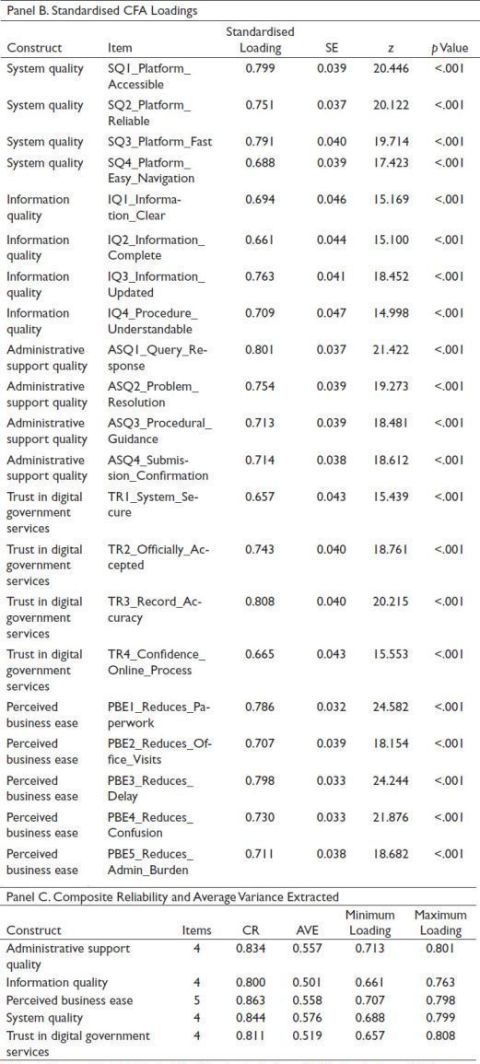
Notes: CFA was estimated using the WLSMV estimator for five-point Likert-scale items. AVE: Average variance extracted; CFI: Comparative fit index; CR: Composite reliability; RMSEA: Root mean square error of approximation; SRMR: Standardised root mean square residual; TLI: Tucker–Lewis index.
Table A5. Full Regression Model and Diagnostic Checks.
.jpg/10_1177_jiift_261465505-table11(1)__410x1178.jpg)
Table A6. Common Method and Robustness Checks.
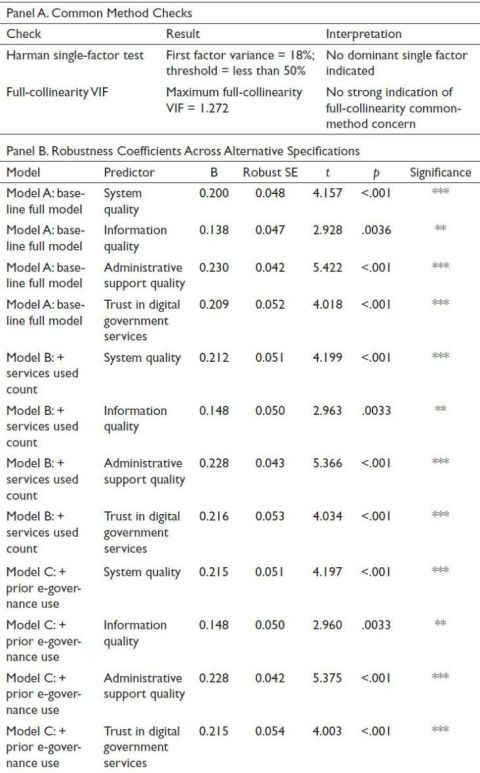
Table A7. Qualitative Case Validation, Themes and Codes.
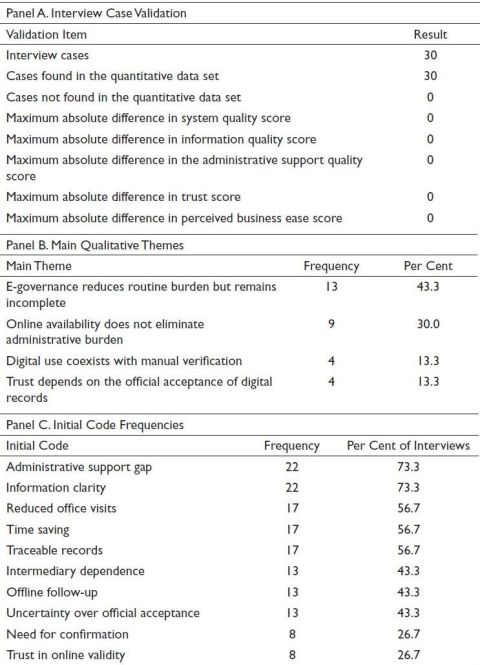
Table A8. Detailed Mixed-methods Joint Display with Representative Quotations.
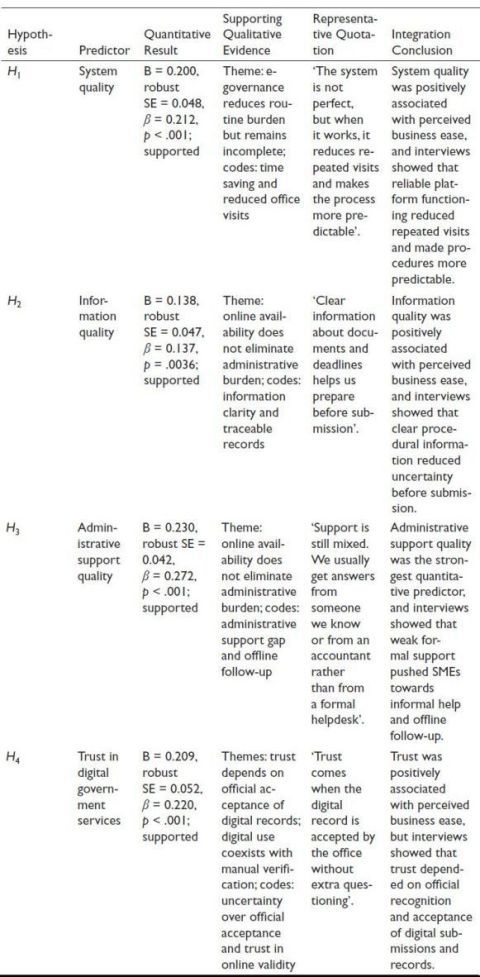
Figure A1. Parallel Analysis for Exploratory Factor Analysis.
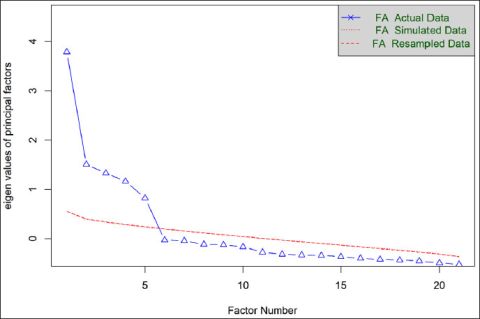
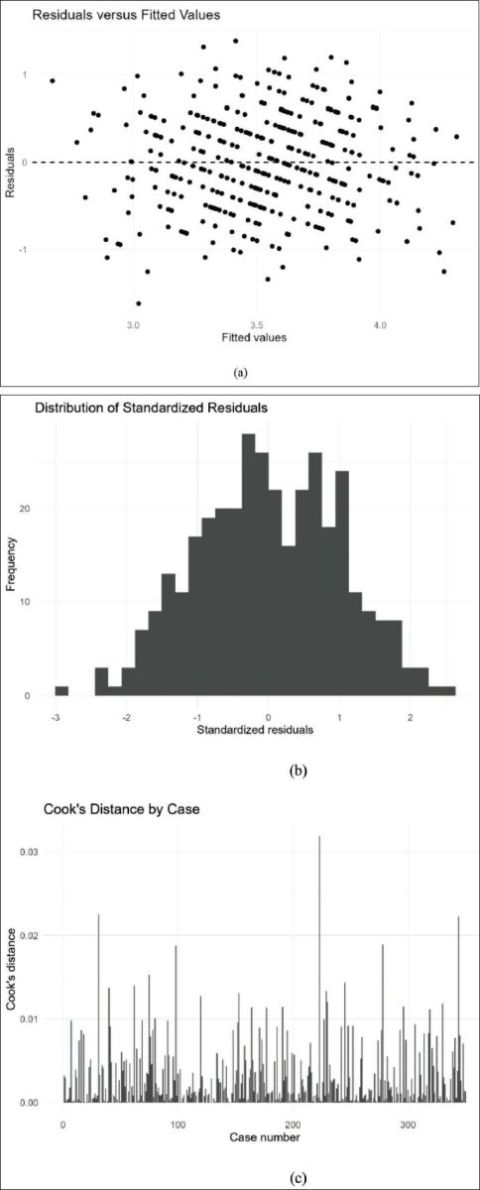
Figure A2. Regression Diagnostic Plots. (a) Residuals Versus Fitted Values. (b) Distribution of Standardised Residuals. (c) Cook’s Distance by Case.