IIFT International Business and Management Review Journal

Sanjaya Pudasaini1  and Rita Bhandari2
1Kathmandu University School of Management (KUSOM), Lalitpur, Bagmati, Nepal
2Public Administration Campus, Tribhuvan University, Kathmandu, Bagmati, Nepal

Creative Commons Non Commercial CC BY-NC: This article is distributed under the terms of the Creative Commons Attribution-NonCommercial 4.0 License (http://www.creativecommons.org/licenses/by-nc/4.0/) which permits non-Commercial use, reproduction and distribution of the work without further permission provided the original work is attributed.
This study examines the association between e-governance service quality and perceived business ease among small and medium-sized enterprises (SMEs) in Kathmandu, Nepal. Using a sequential explanatory mixed-methods design, the study first analysed survey data from 350 SME owners and managers and then conducted 30 semi-structured interviews to explain the quantitative findings. The quantitative results showed that system quality, information quality, administrative support quality and trust in digital government services were all positively associated with perceived business ease. Administrative support quality showed the strongest standardised association, suggesting that SMEs evaluate e-governance not only through platform access but also through the availability of procedural guidance, problem resolution and confirmation support. The qualitative findings reinforced this interpretation by showing that online services reduced routine burden but often remained incomplete when information was unclear, support was weak or digital records required manual verification. The study extends e-governance service-quality research by showing that SMEs assess digital government services through procedural completion rather than access alone. The study concludes that SME-facing e-governance should be assessed through a procedural completion logic rather than an access logic.
E-governance service quality, perceived business ease, small and medium-sized enterprises, administrative burden, procedural completion, Nepal
Introduction
Digital government services are increasingly promoted as a way to simplify administrative interaction between governments and businesses. For small and medium-sized enterprises (SMEs), government-to-business e-governance can support routine procedures such as business registration, tax filing, license renewal, document submission, compliance reporting and access to official information (Das & Das, 2022; Scutella et al., 2024). These services are expected to reduce paperwork, repeated office visits, procedural delays and uncertainty, particularly for firms with limited administrative resources (Martins & Veiga, 2022). For business users, however, the value of e-governance depends not only on whether a service is available online, but also on whether the digital procedure can be completed without repeated clarification, manual verification or offline follow-up.
Online availability, therefore, does not automatically make business procedures easier. SMEs may still face unreliable platforms, unclear procedural information, weak administrative support, limited agency response and uncertainty about whether online submissions are officially accepted (Aljukhadar et al., 2022; Pham et al., 2023). As a result, they may continue to depend on physical visits, intermediaries or informal follow-up even when digital services are available (Scutella et al., 2024). This study conceptualises this problem as a shift from access logic to a procedural completion logic: SME-facing e-governance becomes meaningful when online interaction helps firms complete administrative requirements with less uncertainty, fewer delays and reduced dependence on offline confirmation.
This issue is relevant in emerging economies, where digital public services are expanding but institutional capacity, user readiness and service reliability remain uneven (Pham et al., 2023). Nepal provides a useful setting for examining this issue because national digital transformation initiatives have expanded the policy emphasis on digitally mediated public services, while local-level e-governance studies in Kathmandu District still report implementation constraints related to responsiveness, coordination, administrative capacity and technical resources (Bahadur Giri et al., 2025; Ministry of Communication and Information Technology, 2019). In Kathmandu, SMEs frequently interact with public agencies for registration, taxation, licensing, renewal, documentation and compliance-related procedures. Many of these interactions increasingly include online or digitally mediated components, yet formal completion may still require procedural clarification, document verification, agency confirmation or follow-up through non-digital channels. Kathmandu, therefore, offers a practical setting for examining whether SME-facing e-governance is perceived to reduce administrative burden.
Existing e-governance research has largely examined citizen adoption, user satisfaction, public service delivery or general technology acceptance (Pham et al., 2023). Less attention has been paid to the government-to-business experience of SMEs, especially in emerging-economy contexts (Scutella et al., 2024). This gap matters because SMEs interact with government as regulated business actors, not only as general service users. Unlike citizens using public services for occasional needs, SMEs often engage with government under compliance pressure, where incomplete information, unresolved system problems or uncertainty about official acceptance can delay business activity and increase administrative effort.
This study examines the association between e-governance service quality and perceived business ease among SMEs in Kathmandu, focusing on system quality, information quality, administrative support quality and trust in digital government services (Aljukhadar et al., 2022; Pham et al., 2023). Perceived business ease refers to the extent to which SMEs perceive e-governance as reducing paperwork, delays, physical visits, procedural confusion and administrative burden.
Using a sequential explanatory mixed-methods design, survey data from 350 SME owners and managers were first analysed, followed by 30 semi-structured interviews to explain why e-governance was experienced as helpful, limited or uneven across SMEs (Haynes-Brown, 2023). The study contributes by showing that SME-facing e-governance should be evaluated not only by platform availability or user adoption, but by whether digital services support procedural completion.
Literature Review, Conceptual Framework and Hypotheses Development
Business-facing E-governance and Small and Medium-sized Enterprises
E-governance refers to the use of digital platforms by public institutions to provide information, services and administrative procedures to users (Aljukhadar et al., 2022; Pham et al., 2023). For businesses, e-governance is especially relevant in government-to-business interactions, including business registration, tax filing, license renewal, document submission, compliance reporting and access to official information (Das & Das, 2022; Martins & Veiga, 2022; Scutella et al., 2024). These services are important for SMEs because routine interaction with government agencies can consume time, increase uncertainty and create administrative pressure (Madsen et al., 2022; Martins & Veiga, 2022; Moynihan et al., 2015). Unlike citizen-facing e-governance, business-facing e-governance is tied to compliance obligations, documentation requirements and the need to complete formal procedures correctly.
For SMEs, digital government services are useful only when they make business procedures easier in practice. The existence of an online portal does not automatically reduce administrative difficulty (Madsen et al., 2022; Martins & Veiga, 2022). If the platform is unreliable, information is unclear, support is weak or users are uncertain about the official validity of online procedures, SMEs may continue to depend on physical visits, intermediaries or informal follow-up (Aljukhadar et al., 2022; Pham et al., 2023; Scutella et al., 2024). Therefore, this study focuses on perceived business ease, defined as the extent to which SMEs perceive that e-governance reduces paperwork, delays, physical visits, procedural confusion and administrative burden (Madsen et al., 2022; Martins & Veiga, 2022; Moynihan et al., 2015). In this study, perceived business ease refers to the reduction of these administrative burdens when digital services help SMEs complete procedures with less uncertainty and reduced reliance on offline processes.
E-governance Service Quality
This study adopts an e-governance service quality perspective. Prior studies suggest that digital public services should be evaluated not only by availability, but also by the quality of the service experience (Aljukhadar et al., 2022; Papadomichelaki & Mentzas, 2012; Pham et al., 2023). For SME-facing e-governance, four dimensions are especially relevant: system quality, information quality, administrative support quality and trust in digital government services (Aljukhadar et al., 2022; DeLone & McLean, 2003; Papadomichelaki & Mentzas, 2012; Pham et al., 2023). These dimensions are relevant because digital access alone does not ensure procedural completion.
System quality refers to whether the digital platform is accessible, reliable, fast, stable and easy to navigate (Aljukhadar et al., 2022; DeLone & McLean, 2003). Information quality refers to whether the information provided through the platform is clear, complete, accurate, up to date and useful for completing procedures (DeLone & McLean, 2003; Pham et al., 2023). Administrative support quality refers to whether users receive timely guidance, clarification and problem resolution when they face difficulties (Aljukhadar et al., 2022; Papadomichelaki & Mentzas, 2012; Pham et al., 2023). Trust refers to users’ confidence that online submissions, records, payments and approvals are secure, reliable and formally accepted by public agencies (Alkraiji & Ameen, 2022; Li & Shang, 2023; Papadomichelaki & Mentzas, 2012).
These dimensions are suitable for this study because SMEs evaluate e-governance through practical experience. A digital service is unlikely to improve business ease if the system does not work, the information is confusing, support is unavailable or users do not trust the official validity of online procedures (Alsarraf et al., 2023; Madsen et al., 2022; Scutella et al., 2024). Together, these dimensions capture whether SMEs experience e-governance as a complete administrative process rather than only as an online access point.
Conceptual Framework
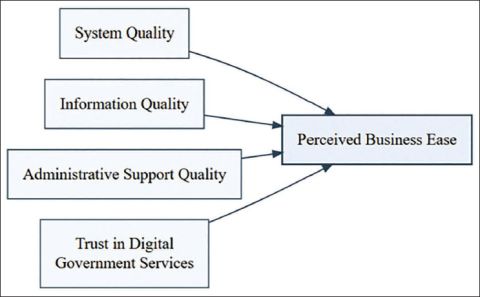
The conceptual framework posits that four dimensions of e-governance service quality are associated with perceived business ease among SMEs.
The framework is intentionally simple. It does not test mediation, moderation or causal pathways. Instead, it examines whether key dimensions of e-governance service quality are associated with SMEs’ perception that business-related administrative procedures have become easier. Arrows in the framework indicate hypothesised associations, not causal effects. Figure 1 presents the conceptual framework linking four dimensions of e-governance service quality with perceived business ease among SMEs.
Figure 1. Conceptual Framework.
Hypotheses Development
System quality is expected to be associated with perceived business ease because SMEs need digital government platforms that are accessible, stable and easy to use. When platforms are slow, unavailable or difficult to navigate, users may spend additional time completing procedures or may return to offline channels. In contrast, reliable and user-friendly platforms can reduce repeated office visits and make administrative procedures more manageable (Aljukhadar et al., 2022; DeLone & McLean, 2003; Martins & Veiga, 2022). Therefore:
H1: System quality of e-governance services is positively associated with perceived business ease among SMEs.
Information quality is also important because SMEs need clear guidance on procedures, required documents, fees, deadlines and application status. If information is incomplete or difficult to understand, online access may not reduce confusion. SMEs may still need to contact officials, visit offices or rely on intermediaries. Clear and updated information can reduce uncertainty and help SMEs complete procedures with fewer errors (Aljukhadar et al., 2022; DeLone & McLean, 2003; Pham et al., 2023). Therefore:
H2: Information quality of e-governance services is positively associated with perceived business ease among SMEs.
Administrative support quality matters because government business procedures often involve formal requirements and potential consequences for non-compliance. Even when online systems are available, SMEs may need assistance to correct mistakes, clarify requirements, confirm submissions or resolve system-related problems. Responsive support can therefore determine whether online access becomes procedural completion rather than another source of delay (Aljukhadar et al., 2022; Papadomichelaki & Mentzas, 2012; Pham et al., 2023). Therefore:
H3: Administrative support quality of e-governance services is positively associated with perceived business ease among SMEs.
Trust in digital government services is important because SMEs need confidence that online procedures are secure, valid and officially recognised. If users doubt whether online submissions or records will be accepted by public agencies, they may continue to seek manual confirmation or physical verification. Higher trust can reduce uncertainty and increase confidence in completing procedures digitally (Alkraiji & Ameen, 2022; Alsarraf et al., 2023; Li & Shang, 2023). Therefore:
H4: Trust in digital government services is positively associated with perceived business ease among SMEs.
Summary
This study argues that e-governance can support SMEs only when digital government services reduce practical administrative difficulty. The proposed framework links system quality, information quality, administrative support quality and trust with perceived business ease. These hypotheses guide the quantitative phase of the study, while the qualitative phase explains why these relationships appear strong, weak or uneven in the everyday experience of SMEs in Kathmandu. Together, the framework positions service quality as a condition for procedural completion, not merely digital access.
Methodology
Research Design
This study used a sequential explanatory mixed-methods design to examine the association between e-governance service quality and perceived business ease among SMEs in Kathmandu, Nepal. Quantitative data were collected and analysed first, followed by qualitative interviews to explain and contextualise the survey findings (Creswell & Plano Clark, 2018; Ivankova et al., 2006). The study followed a QUAN .png) qual structure. The quantitative phase was dominant and consisted of a structured survey of 350 SME owners and managers. The qualitative phase followed the survey and consisted of 30 semi-structured interviews with selected respondents. The qualitative phase was used to explain why e-governance was experienced as helpful, limited or uneven, rather than as a separate, standalone study (Creswell & Plano Clark, 2018; Ivankova et al., 2006). This design was appropriate because survey analysis identified service-quality associations, while interviews explained why digital access did not always translate into procedural completion.
qual structure. The quantitative phase was dominant and consisted of a structured survey of 350 SME owners and managers. The qualitative phase followed the survey and consisted of 30 semi-structured interviews with selected respondents. The qualitative phase was used to explain why e-governance was experienced as helpful, limited or uneven, rather than as a separate, standalone study (Creswell & Plano Clark, 2018; Ivankova et al., 2006). This design was appropriate because survey analysis identified service-quality associations, while interviews explained why digital access did not always translate into procedural completion.
Study Context
Kathmandu was selected because it is Nepal’s main administrative and commercial centre, where SMEs frequently interact with public agencies for registration, taxation, licensing, renewal, documentation and compliance-related procedures. SMEs in Kathmandu are also more likely to encounter both conventional administrative processes and emerging digital government services. This made the city a relevant setting for examining whether government-to-business e-governance services are perceived to reduce administrative burden in everyday business operations.
Quantitative Phase: Survey Design and Respondents
The quantitative phase involved a structured questionnaire survey of 350 SME owners and managers in Kathmandu. Data were collected during February–March 2026. Eligible respondents included owners, managing partners, managers, administrative officers and other personnel responsible for business-related government procedures. One respondent was included from each enterprise. Respondents were included only if their enterprise had used, attempted to use or directly dealt with at least one business-related government service, such as business registration, tax filing, license renewal, document submission, compliance reporting or access to official business information. Respondents reporting ‘no prior e-governance use’ were retained only if they had attempted to access, relied on staff or intermediaries for or directly dealt with business-related government procedures involving digital or hybrid service channels.
A purposive sampling approach was used because a complete and updated sampling frame of SMEs with comparable e-governance exposure was not readily available. Respondents were approached through local business clusters, SME networks, professional contacts, business associations and direct field visits. The sample included SMEs from service, retail, trading, tourism-related, consultancy, IT-enabled and small manufacturing sectors to capture variation in e-governance exposure and administrative experience.
Instrument Development and Measurement
The survey instrument was developed by adapting established measurement dimensions from e-government service quality, e-government systems success, trust in digital government and administrative burden research (DeLone & McLean, 2003; Moynihan et al., 2015; Papadomichelaki & Mentzas, 2012; Wang & Liao, 2008). The study did not create entirely new constructs; rather, it contextualised validated measurement logic for government-to-business e-governance services used by SMEs in Kathmandu.
The questionnaire had two sections. The first section collected respondent and enterprise information, including respondent role, business sector, years of operation, number of employees, prior use of e-governance services and frequency of interaction with digital government services. The second section measured five constructs using 21 five-point Likert-scale items ranging from 1 = strongly disagree to 5 = strongly agree.
System quality and information quality were adapted from the e-government systems success literature, particularly the application of the DeLone and McLean Information Systems Success Model in e-government settings (DeLone & McLean, 2003; Wang & Liao, 2008). System quality captured platform accessibility, reliability, speed, stability and ease of navigation. Information quality captured whether information provided through digital government services was clear, complete, up to date, accurate and useful for completing business procedures.
Administrative support quality was adapted from the citizen support dimension of the E-GovQual scale (Papadomichelaki & Mentzas, 2012). In this study, the construct was modified for the SME-facing context and referred to procedural guidance, query response, problem resolution and confirmation support when SMEs faced difficulties using e-governance services. Trust in digital government services was adapted from the trust dimension of E-GovQual and related e-government trust research (Papadomichelaki & Mentzas, 2012). It referred to SME confidence in the security, reliability, accuracy and official acceptance of online submissions, records, payments and approvals.
Perceived business ease was adapted from administrative burden research, which explains burden through learning, compliance and psychological costs in interactions with the state (Moynihan et al., 2015). Because this study examined whether e-governance reduced rather than created burden, the items were worded positively to capture perceived reductions in paperwork, office visits, procedural delay, confusion and administrative effort.
The draft instrument was reviewed by five academic and practitioner experts to assess content validity, wording clarity and contextual relevance. A pilot test was then conducted with 30 SME respondents to identify unclear wording, repetitive items, response difficulty and approximate completion time (Boateng et al., 2018). Minor revisions were made before full data collection.
Quantitative Data Analysis
Quantitative data were screened for incomplete responses, missing values, straight-lining, coding errors and inconsistent response patterns. Descriptive statistics summarised respondent profiles, SME characteristics, e-governance use and construct-level responses. Reliability was assessed using Cronbach’s alpha and corrected item-total correlations. Exploratory factor analysis was first used to examine whether the adapted items loaded meaningfully on their intended constructs in the Nepalese SME context. Confirmatory factor analysis was then conducted using the WLSMV estimator, which was appropriate because the measurement items used five-point Likert response scales. Model fit was assessed using χ2, CFI, TLI, RMSEA and SRMR, while composite reliability and average variance extracted were used to assess construct reliability and convergent validity.
Correlation analysis examined the relationships among system quality, information quality, administrative support quality, trust and perceived business ease. Multiple regression analysis was then used to test whether the four e-governance service-quality dimensions were associated with perceived business ease after controlling for firm size, firm age, sector, respondent role and prior e-governance use frequency. Variance inflation factor values were checked to assess multicollinearity. Because the data were cross-sectional and perception-based, the results were interpreted as associations rather than causal effects. Quantitative analyses were conducted in R, using lavaan for confirmatory factor analysis.
Qualitative Phase and Analysis
After the preliminary quantitative analysis, 30 SME owners and managers were selected for semi-structured interviews. Selection followed a purposive logic to capture variation in survey responses, including high and low perceived business ease, frequent and infrequent e-governance use, high and low trust and continued reliance on offline procedures (Creswell & Plano Clark, 2018; Ivankova et al., 2006). This selection strategy supported the explanatory purpose of the qualitative phase. Interviews lasted approximately 45 min.
The interviews explored how SMEs experienced e-governance services, which services they used, what benefits they perceived, what barriers remained and why digital services did or did not reduce administrative burden. Questions focused on system reliability, information clarity, administrative support, trust in online submissions, official acceptance, digital skills and dependence on intermediaries or physical follow-up.
Interview data were analysed using thematic analysis (Braun & Clarke, 2006, 2023). Coding combined deductive and inductive logic. Deductive codes followed the quantitative constructs: system quality, information quality, administrative support quality, trust and perceived business ease. Inductive codes captured issues emerging from participants’ accounts, such as system downtime, unclear instructions, repeated document submission, lack of response, fear of mistakes and reliance on intermediaries.
Integration and Ethical Considerations
Integration occurred after both phases were completed. A joint display connected major quantitative results with qualitative themes and illustrative quotations (Fetters et al., 2013; Guetterman et al., 2015). This integration allowed the study to explain not only which e-governance dimensions mattered, but also why they mattered in SME practice (Creswell & Plano Clark, 2018; Fetters et al., 2013).
All participants were informed about the purpose of the study, the voluntary nature of participation, confidentiality and their right to withdraw. Survey and interview data were used only for academic purposes. Interview participants were assigned codes, and no names, business identities or sensitive operational details were reported.
Results
Data Screening and Sample Profile
The quantitative data set included 350 SME respondents. Initial screening showed no duplicate SME IDs, no missing responses across the 21 Likert-scale items and no out-of-range values. The recalculated construct matched the existing mean variables exactly, and no straight-lining cases were detected. Therefore, all 350 responses were retained for analysis.
The sample covered SMEs from different sectors, firm sizes and e-governance use profiles. Retail/wholesale firms represented the largest group (27.1%), followed by services (23.1%) and tourism/hospitality (16.6%). Most firms were small enterprises (58.3%), while micro and medium-sized enterprises accounted for 25.1% and 16.6%, respectively. Most respondents had prior experience with e-governance services (72.6%), although frequency of use varied across the sample. Respondents reporting no prior e-governance use or ‘never’ use frequency were retained because they had still dealt with business-related government procedures through attempted access, staff support, intermediaries or hybrid offline–digital channels.
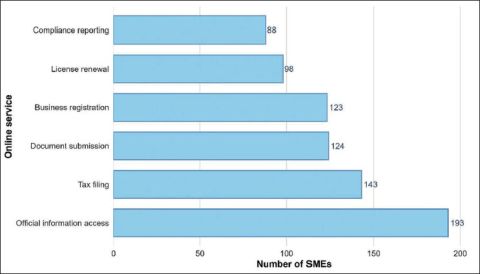
Official information access was the most frequently used online government service (55.1%), followed by tax filing (40.9%), document submission (35.4%), business registration (35.1%), license renewal (28.0%) and compliance reporting (25.1%). Table 1 presents the sample profile and respondents’ exposure to e-governance services. These patterns are summarised visually in Figure 2, while detailed service-use frequencies are provided in Appendix Table A1.
Table 1. Sample Profile and E-governance Exposure.
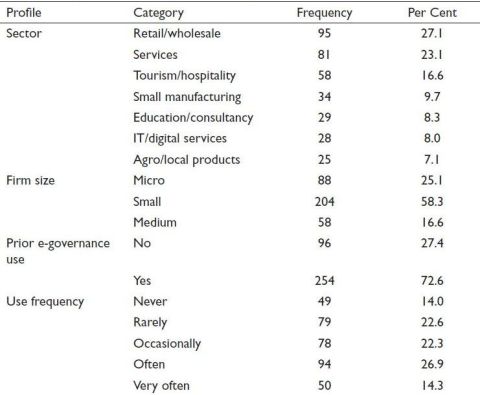
Figure 2. Online Government Services Used by Small and Medium-sized Enterprises.
Descriptive Statistics and Measurement Reliability
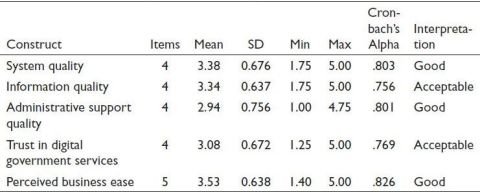
Table 2 presents construct-level descriptive statistics and reliability results. Perceived business ease had the highest mean score (M = 3.53, SD = 0.638), followed by system quality (M = 3.38, SD = 0.676), information quality (M = 3.34, SD = 0.637), trust in digital government services (M = 3.08, SD = 0.672) and administrative support quality (M = 2.94, SD = 0.756). The relatively lower mean for administrative support quality suggests that support-related aspects of e-governance were evaluated less favourably than system access or information availability.
All constructs demonstrated acceptable or good internal consistency. Cronbach’s alpha values ranged from .756 to .826. Corrected item-total correlations were above .30 for all items, and no item deletion was justified. Therefore, all 21 items were retained. Item-level descriptive statistics and reliability diagnostics are reported in Appendix Table A2. Exploratory factor analysis results are reported in Appendix Table A3, while confirmatory measurement results are reported in Appendix Table A4.
Factor Structure
The measurement structure was assessed using exploratory and confirmatory factor analysis. The data were suitable for factor analysis, with KMO = 0.825 and Bartlett’s test significant, χ2(210) = 2,265, p < .001. Exploratory factor analysis supported a five-factor solution consistent with the study’s constructs; primary loadings ranged from 0.596 to 0.774, no problematic cross-loadings were observed and the solution explained 48.6% of cumulative variance. The EFA loadings are reported in Appendix Table A3, and the parallel analysis output is reported in Appendix Figure A1. Confirmatory factor analysis using WLSMV also showed very good model fit, χ2(179) = 155.14, p = .901, CFI = 1.000, TLI = 1.009, RMSEA = 0.000, 90% CI [0.000, 0.011] and SRMR = 0.036. Standardised CFA loadings ranged from 0.657 to 0.808, composite reliability ranged from 0.800 to 0.863 and AVE ranged from 0.501 to 0.576. Detailed CFA results are reported in Appendix Table A4.
Table 2. Construct Descriptives and Reliability.
Correlation Analysis
Table 3 reports the correlation matrix. All four e-governance service-quality dimensions were positively and significantly associated with perceived business ease. Administrative support quality showed the strongest bivariate association with perceived business ease (r = .327, p < .001), followed by system quality (r = .275, p < .001), trust in digital government services (r = .266, p < .001) and information quality (r = .204, p < .001). Correlations among the predictor variables were low, suggesting that the four dimensions captured related but distinct aspects of e-governance service quality.
Regression Results
Multiple regression analysis was conducted to test the four hypotheses. Perceived business ease was entered as the dependent variable. System quality, information quality, administrative support quality and trust in digital government services were entered as the main predictors. The model controlled for years of operation, firm size, sector, respondent role and e-governance use frequency. Robust standard errors were used.
The full model was statistically significant and explained 24.3% of the variance in perceived business ease (R2 = 0.243; adjusted R2 = 0.202). The predictors-only model explained 23.0% of the variance, whereas the controls-only model explained 1.5%. This indicates that perceived business ease was more strongly associated with e-governance service-quality dimensions than with firm profile characteristics.
Table 3. Correlation Matrix with Cronbach’s Alpha on the Diagonal.
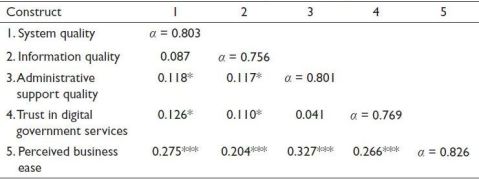
Note: *p < .05; **p < .01; ***p < .001.
Table 4. Regression Results and Hypothesis Testing.
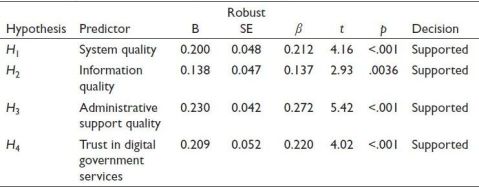
All four hypotheses were supported. System quality was positively associated with perceived business ease (B = 0.200, robust SE = 0.048, β = 0.212, p < .001), supporting H1. Information quality was also positively associated with perceived business ease (B = 0.138, robust SE = 0.047, β = 0.137, p = .0036), supporting H2. Administrative support quality showed the strongest standardised association (B = 0.230, robust SE = 0.042, β = 0.272, p < .001), supporting H3. Trust in digital government services was positively associated with perceived business ease (B = 0.209, robust SE = 0.052, β = 0.220, p < .001), supporting H4.
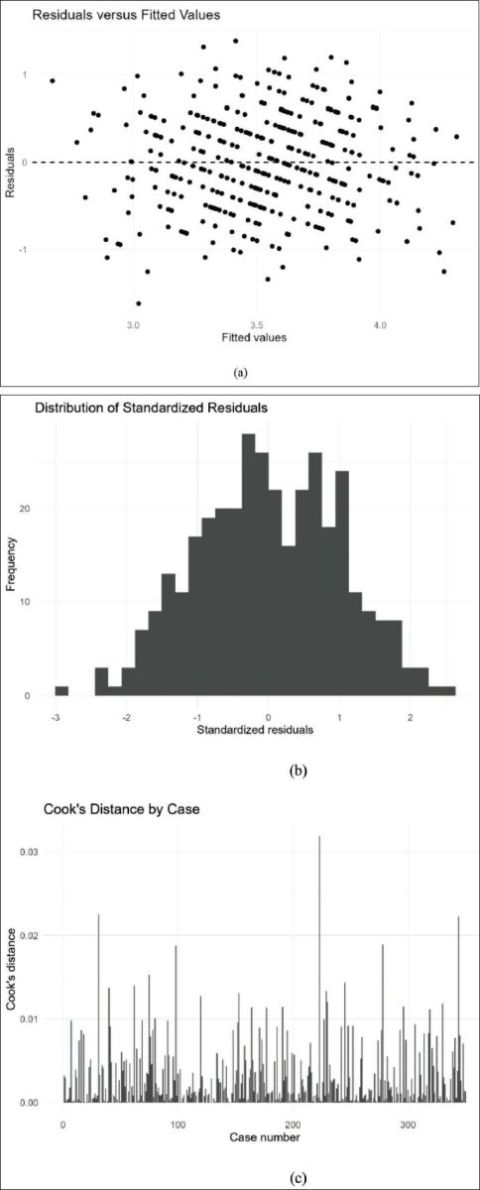
Table 4 presents the regression results and hypothesis-testing outcomes. The full regression model, including control variables, is reported in Appendix Table A5. Multicollinearity diagnostics indicated no serious concern, with adjusted GVIF values close to 1 across predictors and controls. Residual and influence diagnostics also did not indicate problematic cases. These checks are reported in Appendix Table A5 and Appendix Figure A2a–2c.
Common Method and Robustness Checks
Additional checks were conducted because the survey relied on self-reported perceptual measures. Harman’s single-factor test showed that the first unrotated factor explained 18% of the total variance, below the 50% threshold. A full-collinearity VIF check produced a maximum VIF of 1.272, suggesting no strong indication of full-collinearity bias. Robustness models were then estimated by adding service-exposure controls, including service-use count and prior e-governance use. The signs and significance of all four main predictors remained stable across these alternative specifications. Detailed common method and robustness results are reported in Appendix Table A6. Because the survey relied on self-reported perceptual data, common-method variance cannot be fully ruled out.
Qualitative Findings
The qualitative phase included 30 SME owners and managers selected from the survey respondents. All 30 interview cases matched the quantitative data set, confirming consistency between the two phases. The interview sample included variation across sectors, firm sizes, e-governance use frequency, perceived benefits and trust profiles. Case validation details are reported in Appendix Table A7.
Four themes emerged from the interviews: e-governance reduces routine burden but remains incomplete; online availability does not eliminate administrative burden; digital use coexists with manual verification; and trust depends on official acceptance of digital records.
Initial codes provided further detail. Administrative support gap and information clarity were each identified in 22 interviews. Reduced office visits, time saving and traceable records each appeared in 17 interviews. Intermediary dependence, offline follow-up and uncertainty over official acceptance each appeared in 13 interviews. Overall, the interviews showed that SMEs value digital services, but only when those services reduce the need for clarification, follow-up and manual confirmation. Qualitative theme counts, code frequencies and representative quotations are reported in Appendix Table A7 and Appendix Table A8.
Mixed-methods Integration
The quantitative and qualitative findings were integrated through a joint display. Quantitatively, all four e-governance service-quality dimensions were positively associated with perceived business ease. Qualitatively, SMEs explained that digital government services reduce administrative burden only when platforms work reliably, information is clear, administrative support is responsive and online procedures are trusted as officially valid.
Administrative support quality was the strongest quantitative predictor and also one of the most frequent qualitative concerns. The qualitative phase added explanatory detail by showing that digital access did not automatically lead to procedural completion; support gaps and uncertainty about official acceptance pushed SMEs back towards offline confirmation.
Table 5 presents the mixed-methods joint display, integrating the quantitative findings with qualitative explanations and the overall interpretation for each hypothesis. A detailed joint display with representative quotations is reported in Appendix Table A8.
Table 5. Mixed-methods Joint Display.
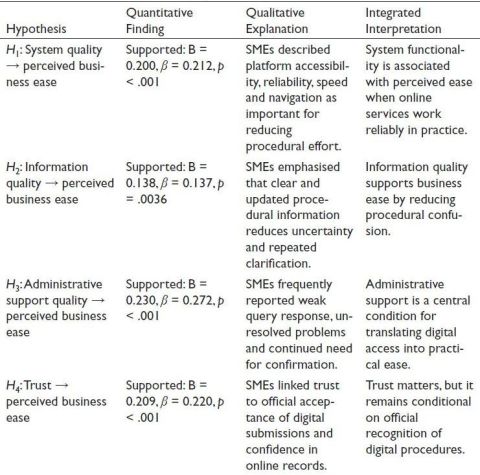
Figure 3. Mixed-methods Integration of Quantitative Effects and Qualitative Evidence.
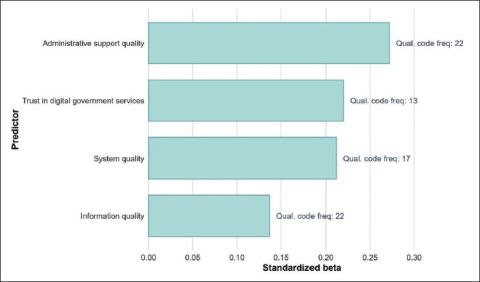
Overall, the results suggest that e-governance service quality is positively associated with perceived business ease among SMEs in Kathmandu. However, the qualitative findings show that digital availability alone is insufficient. SMEs experience e-governance as easier and more useful when systems are reliable, information is clear, administrative support is available and online procedures are trusted as officially valid. Figure 3 illustrates the mixed-methods integration of standardized quantitative effects and qualitative code frequencies across the four predictors.
Discussion
This study examined whether e-governance service quality is associated with perceived business ease among SMEs in Kathmandu. The findings support all four hypotheses, but the broader contribution is not simply that better digital services are associated with easier business procedures. More importantly, the findings show that SMEs judge e-governance by whether online access reduces administrative uncertainty and enables procedural completion (Madsen et al., 2022; Martins & Veiga, 2022).
The support for H1 indicates that system quality remains a basic requirement for SME-facing e-governance. Reliable, accessible, fast and navigable platforms are necessary because technical failures immediately convert digital services into additional work. This aligns with the e-government service-quality literature, which treats system performance as a foundation for digital public service effectiveness (Aljukhadar et al., 2022; DeLone & McLean, 2003; Wang & Liao, 2008). However, system quality alone is insufficient: a working portal may enable submission, but business ease depends on whether the submission is received, processed and accepted.
Support for H2 indicates that information quality is also relevant. Clear, up-to-date procedural information helps SMEs understand documents, fees, deadlines and required steps. Yet information quality had the weakest standardised association among the four predictors. This suggests that information matters when it is usable for action; general information may reduce confusion, but it cannot fully reduce burden if SMEs still need informal interpretation, physical confirmation or intermediary help. In business-facing e-governance, information quality should therefore be understood as procedural usability rather than mere content availability (Aljukhadar et al., 2022; DeLone & McLean, 2003; Pham et al., 2023).
The strongest result was for administrative support quality, supporting H3. This is the key empirical insight of the study. SMEs do not experience e-governance as a portal alone; they experience it as an administrative service chain. Business procedures involve documents, payments, deadlines, approvals and compliance consequences. In such settings, support is not secondary; query response, problem resolution, procedural guidance, confirmation and escalation channels determine whether digital procedures become practically usable. This finding connects e-governance service quality with the administrative burden theory: digitalisation reduces burden only when it reduces learning costs, compliance effort and procedural uncertainty (Madsen et al., 2022; Martins & Veiga, 2022; Moynihan et al., 2015). The interviews reinforced this interpretation by showing that support gaps pushed SMEs back towards offline follow-up.
The support for H4 shows that trust is also central, but the interviews clarify what kind of trust matters. For SMEs, trust is not only confidence in platform security or technical accuracy. It is confidence that online submissions, receipts and records will be treated as officially valid by public offices. This institutional form of trust is especially important in government-to-business settings because firms face compliance risks if procedures are not properly recognised. When SMEs still print documents, visit offices or contact intermediaries after using online systems, trust remains incomplete because the online procedure has not achieved administrative finality (Alkraiji & Ameen, 2022; Alsarraf et al., 2023; Li & Shang, 2023).
Together, the findings suggest that SME-facing e-governance should be evaluated through a completion logic rather than an access logic. Access logic asks whether services are online; completion logic asks whether SMEs can finish procedures with less effort, less uncertainty and fewer offline dependencies. The findings indicate that completion depends on functioning systems, actionable information, responsive support and official acceptance of digital records (Madsen et al., 2022; Scutella et al., 2024).
Theoretical Implications
This study makes three theoretical contributions. First, it shifts e-governance analysis from general citizen adoption towards government-to-business service quality. SMEs interact with the state as regulated economic actors, not only as public service users. Their digital service experience is shaped by registration, taxation, licensing, renewal, documentation and compliance requirements (Das & Das, 2022; Martins & Veiga, 2022; Scutella et al., 2024).
Second, the study positions administrative support quality as a core dimension of SME-facing e-governance. While digital service-quality models commonly emphasise system quality, information quality and trust, this study shows that support quality becomes especially important when users face formal procedures and consequences for error (Aljukhadar et al., 2022; Papadomichelaki & Mentzas, 2012; Pham et al., 2023).
Third, the mixed-methods design strengthens interpretation by connecting statistical associations with procedural experience. The survey identified the relevant service-quality associations, while the interviews explained why online availability may still leave procedures incomplete (Creswell & Plano Clark, 2018; Fetters et al., 2013; Guetterman et al., 2015; Ivankova et al., 2006).
Practical Implications
For public agencies, the findings suggest that e-governance reform should not be measured by the number of services placed online. Agencies should instead design for procedural completion. This requires stable platforms, clear procedural information, responsive support channels and consistent official acceptance of digital records. Priority improvements include submission confirmation, status tracking, help desks, query-resolution timelines, escalation mechanisms and office-wide recognition of online receipts and records (Madsen et al., 2022; Martins & Veiga, 2022; Pham et al., 2023).
For SME support organisations, the findings suggest that training should move beyond portal navigation. SMEs need guidance on submission evidence, record validity, procedural status and when online completion is administratively sufficient (Das & Das, 2022; Scutella et al., 2024).
Limitations and Future Research
This study has limitations. First, the quantitative data are cross-sectional and perception-based, so the findings should be interpreted as associations rather than causal effects. Future studies could use longitudinal or before-and-after designs to examine whether improvements in service quality reduce administrative burden over time. Second, the study used purposive sampling among SMEs in Kathmandu, so the findings should not be treated as statistically representative of all SMEs in Nepal. Future research could compare firms across provinces or between urban and non-urban settings. Third, the qualitative phase captured SME perspectives but did not include public officials, portal administrators or intermediaries. Including these actors could explain why support gaps and inconsistent acceptance persist. Fourth, perceived business ease was measured subjectively. Future studies could combine perceptual measures with objective indicators such as processing time, office visits, resubmission frequency, compliance cost and time spent resolving procedural problems. Finally, because the survey relied on self-reported data, common-method risk cannot be fully ruled out.
Conclusion
This study examined the association between e-governance service quality and perceived business ease among SMEs in Kathmandu. System quality, information quality, administrative support quality and trust were all positively associated with perceived business ease, with administrative support quality showing the strongest association.
The integrated findings show that e-governance improves perceived business ease when digital access leads to procedural completion. Online services remain incomplete when information is unclear, support is weak, records require manual confirmation or agencies do not consistently accept digital submissions. The study, therefore, concludes that SME-facing e-governance should be judged by procedural completion: whether digital services make business procedures easier, more reliable and less dependent on offline confirmation.
Data Confidentiality Statement
All survey and interview data were handled confidentially and used only for research purposes. Identifying information was removed or coded before analysis and reporting.
Declaration of Conflicting Interests
The authors declared no potential conflicts of interest with respect to the research, authorship and/or publication of this article.
Ethics Approval and Informed Consent
All participants were informed about the purpose of the study, the voluntary nature of participation, confidentiality and their right to withdraw at any stage. Participation was based on informed consent. Survey and interview data were used only for academic purposes. Interview participants were assigned codes, and no names, business identities or sensitive operational details were reported.
Funding
The authors received no financial support for the research, authorship and/or publication of this article.
ORCID iD
Sanjaya Pudasaini https://orcid.org/0009-0009-9914-0372
Aljukhadar, M., Belisle, J.-F., Dantas, D. C., Sénécal, S., & Titah, R. (2022). Measuring the service quality of governmental sites: Development and validation of the e-government service quality (EGSQUAL) scale. Electronic Commerce Research and Applications, 55, 101182. https://doi.org/10.1016/j.elerap.2022.101182
Alkraiji, A., & Ameen, N. (2022). The impact of service quality, trust and satisfaction on young citizen loyalty towards government e-services. Information Technology & People, 35(4), 1239–1270. https://doi.org/10.1108/ITP-04-2020-0229
Alsarraf, H. A., Aljazzaf, S., & Ashkanani, A. M. (2023). Do you see my effort? An investigation of the relationship between e-government service quality and trust in government. Transforming Government: People, Process and Policy, 17(1), 116–133. https://doi.org/10.1108/TG-05-2022-0066
Bahadur Giri, P., Raj Giri, U., Raj Giri, B., Giri, A., & Pokhrel, T. (2025). E-governance and service delivery in Nepal: Evidence from Nagarjun Municipality. International Journal of Managing Public Sector Information and Communication Technologies, 16(4), 1–14. https://doi.org/10.5121/ijmpict.2025.16401
Boateng, G. O., Neilands, T. B., Frongillo, E. A., Melgar-Quiñonez, H. R., & Young, S. L. (2018). Best practices for developing and validating scales for health, social, and behavioral research: A primer. Frontiers in Public Health, 6. https://doi.org/10.3389/fpubh.2018.00149
Braun, V., & Clarke, V. (2006). Using thematic analysis in psychology. Qualitative Research in Psychology, 3(2), 77–101. https://doi.org/10.1191/1478088706qp063oa
Braun, V., & Clarke, V. (2023). Toward good practice in thematic analysis: Avoiding common problems and be(com)ing a knowing researcher. International Journal of Transgender Health, 24(1), 1–6. https://doi.org/10.1080/26895269.2022.2129597
Creswell, J. W., & Plano Clark, V. L. (2018). Designing and conducting mixed methods research (3rd ed.). Sage Publications.
Das, A., & Das, S. S. (2022). E-government and entrepreneurship: Online government services and the ease of starting business. Information Systems Frontiers, 24(3), 1027–1039. https://doi.org/10.1007/s10796-021-10121-z
DeLone, W. H., & McLean, E. R. (2003). The DeLone and McLean model of information systems success: A ten-year update. Journal of Management Information Systems, 19(4), 9–30. https://doi.org/10.1080/07421222.2003.11045748
Fetters, M. D., Curry, L. A., & Creswell, J. W. (2013). Achieving integration in mixed methods designs—principles and practices. Health Services Research, 48(6pt2), 2134–2156. https://doi.org/10.1111/1475-6773.12117
Guetterman, T. C., Fetters, M. D., & Creswell, J. W. (2015). Integrating quantitative and qualitative results in health science mixed methods research through joint displays. The Annals of Family Medicine, 13(6), 554–561. https://doi.org/10.1370/afm.1865
Haynes-Brown, T. K. (2023). Using theoretical models in mixed methods research: An example from an explanatory sequential mixed methods study exploring teachers’ beliefs and use of technology. Journal of Mixed Methods Research, 17(3), 243–263. https://doi.org/10.1177/15586898221094970
Ivankova, N. V., Creswell, J. W., & Stick, S. L. (2006). Using mixed-methods sequential explanatory design: From theory to practice. Field Methods, 18(1), 3–20. https://doi.org/10.1177/1525822X05282260
Li, Y., & Shang, H. (2023). How does e-government use affect citizens’ trust in government? Empirical evidence from China. Information & Management, 60(7), 103844. https://doi.org/10.1016/j.im.2023.103844
Madsen, C. Ø., Lindgren, I., & Melin, U. (2022). The accidental caseworker—How digital self-service influences citizens’ administrative burden. Government Information Quarterly, 39(1), 101653. https://doi.org/10.1016/j.giq.2021.101653
Martins, J., & Veiga, L. G. (2022). Digital government as a business facilitator. Information Economics and Policy, 60, 100990. https://doi.org/10.1016/j.infoecopol.2022.100990
Ministry of Communication and Information Technology. (2019). Digital Nepal framework: Unlocking Nepal’s growth potential.
Moynihan, D., Herd, P., & Harvey, H. (2015). Administrative burden: Learning, psychological, and compliance costs in citizen-state interactions. Journal of Public Administration Research and Theory, 25(1), 43–69. https://doi.org/10.1093/jopart/muu009
Papadomichelaki, X., & Mentzas, G. (2012). e-GovQual: A multiple-item scale for assessing e-government service quality. Government Information Quarterly, 29(1), 98–109. https://doi.org/10.1016/j.giq.2011.08.011
Pham, L., Limbu, Y. B., Le, M. T. T., & Nguyen, N. L. (2023). E-government service quality, perceived value, satisfaction, and loyalty: Evidence from a newly emerging country. Journal of Public Policy, 43(4), 812–833. https://doi.org/10.1017/S0143814X23000296
Scutella, M., Plewa, C., & Reaiche, C. (2024). Small businesses and e-government participation: The role of personalisation preference and intermediaries. Internet Research, 34(3), 917–938. https://doi.org/10.1108/INTR-02-2021-0107
Wang, Y.-S., & Liao, Y.-W. (2008). Assessing eGovernment systems success: A validation of the DeLone and McLean model of information systems success. Government Information Quarterly, 25(4), 717–733. https://doi.org/10.1016/j.giq.2007.06.002
Appendix A
Table A1. Detailed Online Government Service Use Among Small and Medium-sized Enterprises.
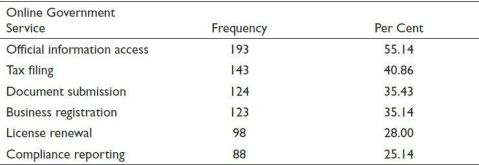
Table A2. Item-level Descriptive Statistics and Reliability Diagnostics.
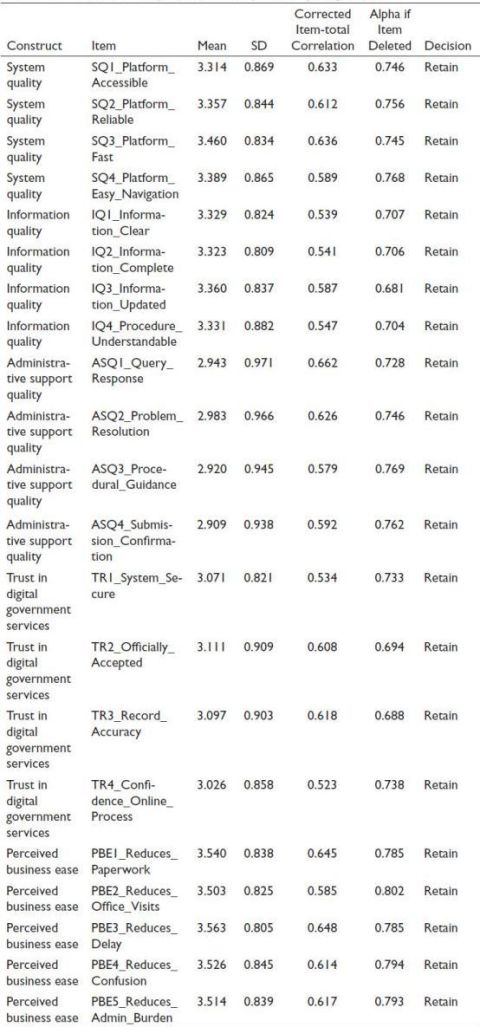
Table A3. Exploratory Factor Analysis Loading Diagnostics.
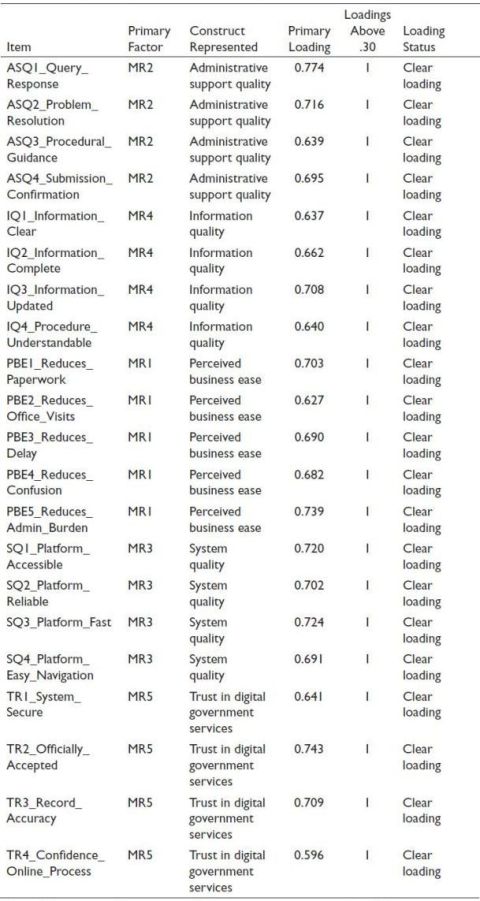
Note: MR1 = perceived business ease; MR2 = administrative support quality; MR3 = system quality; MR4 = information quality; MR5 = trust in digital government services.
Table A4. Confirmatory Factor Analysis Results.
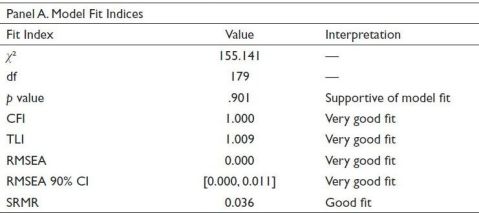
Notes: CFA was estimated using the WLSMV estimator for five-point Likert-scale items. The fit indices indicate very good model fit, but they are interpreted cautiously alongside factor loadings, composite reliability and average variance extracted. AVE: Average variance extracted; CFI: Comparative fit index; CR: Composite reliability; RMSEA: Root mean square error of approximation; SRMR: Standardised root mean square residual; TLI: Tucker–Lewis index.
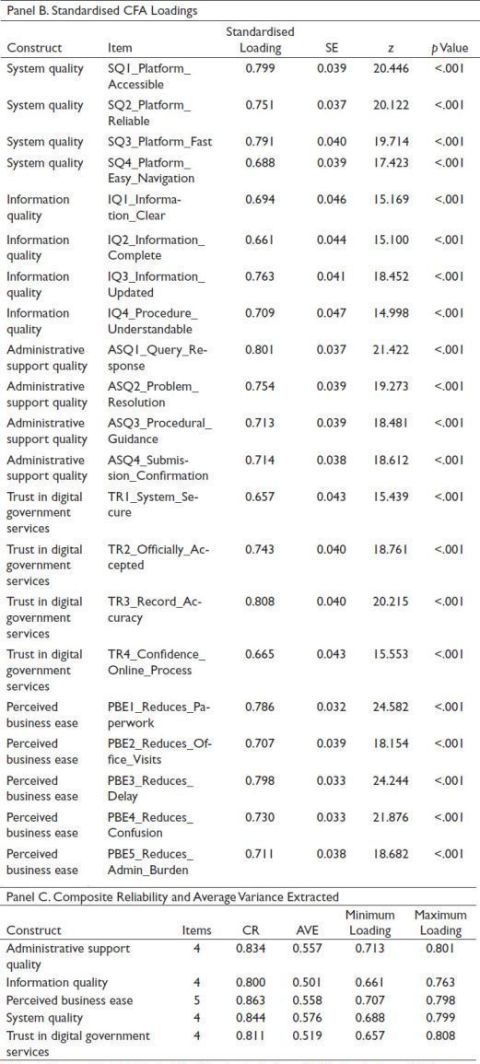
Notes: CFA was estimated using the WLSMV estimator for five-point Likert-scale items. AVE: Average variance extracted; CFI: Comparative fit index; CR: Composite reliability; RMSEA: Root mean square error of approximation; SRMR: Standardised root mean square residual; TLI: Tucker–Lewis index.
Table A5. Full Regression Model and Diagnostic Checks.
.jpg/10_1177_jiift_261465505-table11(1)__410x1178.jpg)
Table A6. Common Method and Robustness Checks.
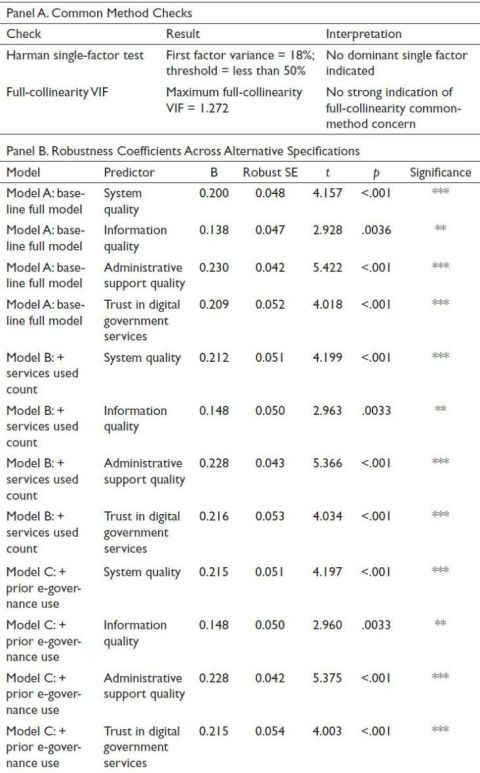
Table A7. Qualitative Case Validation, Themes and Codes.
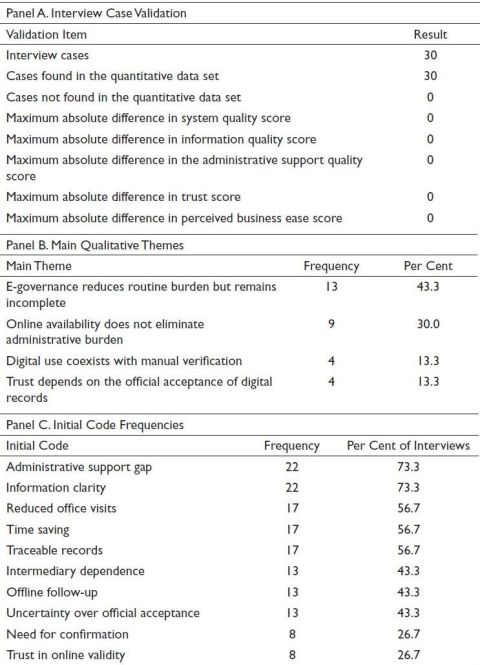
Table A8. Detailed Mixed-methods Joint Display with Representative Quotations.
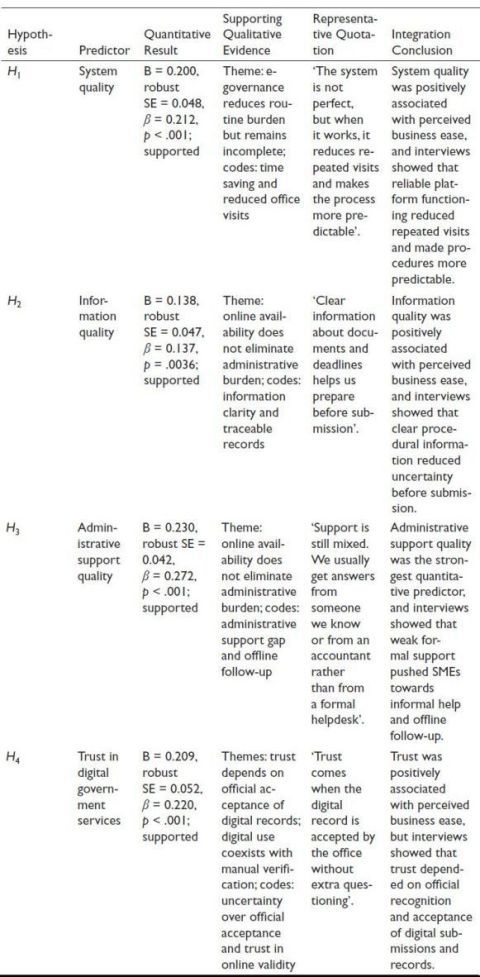
Figure A1. Parallel Analysis for Exploratory Factor Analysis.
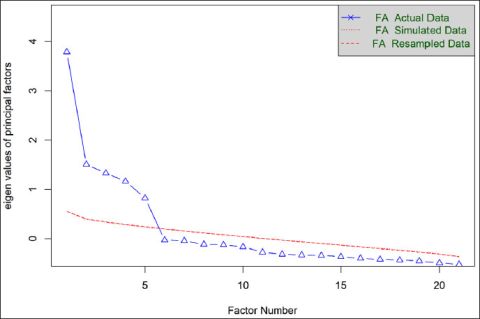
Figure A2. Regression Diagnostic Plots. (a) Residuals Versus Fitted Values. (b) Distribution of Standardised Residuals. (c) Cook’s Distance by Case.