IIFT International Business and Management
Review Journal
Review Journal

 Search
1 National Institute of Fashion Technology, NIFT Campus, Bhauri, Bhopal, Madhya Pradesh, India

Creative Commons Non Commercial CC BY-NC: This article is distributed under the terms of the Creative Commons Attribution-NonCommercial 4.0 License (http://www.creativecommons.org/licenses/by-nc/4.0/) which permits non-Commercial use, reproduction and distribution of the work without further permission provided the original work is attributed.
The research is performed keeping in view the traffic congestion in urban areas, especially metro cities in India. Getting stuck in jams for hours is a habitual matter. The peak hours are a peril. In just four metro cities in India (New Delhi, Mumbai, Kolkata and Bengaluru), traffic congestion is so high that the fuel that is burnt due to idling of vehicles at traffic jams costs around .png) 1.5 lakh crore annually ($18.75 billion). The situation is worst in the nation’s capital, New Delhi, with over $8.5 billion. Overall growth in population and economic upliftment, especially in the middle-class section, shaped an upsurge in demand for private transportation. Uber research estimates that the transport demand has increased by more than eight times since 1980 in urban India (Financial Express, 2018). According to findings by the Central Road Research Institute (CRRI) in the nation’s capital, New Delhi, every day 39,806 kg of fuel is burnt due to idling of vehicles at traffic jams (Adak, 2014). The article highlights problems faced by commuters, taking into account New Delhi as a case study. It is also largely because Delhi is affected by one of the highest vehicle densities among all the cities in the world (Adak, 2014). The assessment includes continuous observation and interview process of commuters belonging to different socio-economic classes in different areas of the city on (a) mode of transport used by them/preferred by them, (b) decision making towards the preferred mode of transport in the face of uncertainty, that is, traffic and (c) problems faced due to lack of consistent information regarding traffic. The article also discusses redefining the user interface and thereby their experience and forming an efficient and planned social system.
1.5 lakh crore annually ($18.75 billion). The situation is worst in the nation’s capital, New Delhi, with over $8.5 billion. Overall growth in population and economic upliftment, especially in the middle-class section, shaped an upsurge in demand for private transportation. Uber research estimates that the transport demand has increased by more than eight times since 1980 in urban India (Financial Express, 2018). According to findings by the Central Road Research Institute (CRRI) in the nation’s capital, New Delhi, every day 39,806 kg of fuel is burnt due to idling of vehicles at traffic jams (Adak, 2014). The article highlights problems faced by commuters, taking into account New Delhi as a case study. It is also largely because Delhi is affected by one of the highest vehicle densities among all the cities in the world (Adak, 2014). The assessment includes continuous observation and interview process of commuters belonging to different socio-economic classes in different areas of the city on (a) mode of transport used by them/preferred by them, (b) decision making towards the preferred mode of transport in the face of uncertainty, that is, traffic and (c) problems faced due to lack of consistent information regarding traffic. The article also discusses redefining the user interface and thereby their experience and forming an efficient and planned social system.
Road traffic, traffic congestion, user interface, application system
Introduction
The location of New Delhi is between the latitudes of 28.png) -24'-17" and 28
-24'-17" and 28.png) -53'-00" North and longitudes of 76
-53'-00" North and longitudes of 76.png) -50'-24" and 77
-50'-24" and 77.png) -20'-37" East. The city has a common border with the adjacent states of Uttar Pradesh and Haryana. With 11 districts, it has a total area of 1,483 km2. The city measures 51.90 km in the utmost length and 48.48 km in the utmost breadth. Urbanisation has almost engulfed the rural area of the region. In the year 1901, the rural population in the region was nearly 50%. It reduced to less than 7% in 2001 census. It is a result of villages being faded away, providing space to skyrisers and commercial spaces. The villages, which were 314 in 1921, reduced to 165 in 2001.
-20'-37" East. The city has a common border with the adjacent states of Uttar Pradesh and Haryana. With 11 districts, it has a total area of 1,483 km2. The city measures 51.90 km in the utmost length and 48.48 km in the utmost breadth. Urbanisation has almost engulfed the rural area of the region. In the year 1901, the rural population in the region was nearly 50%. It reduced to less than 7% in 2001 census. It is a result of villages being faded away, providing space to skyrisers and commercial spaces. The villages, which were 314 in 1921, reduced to 165 in 2001.
The present population of Delhi is circa 32,941,308 (approximately 32.9 million) (World Population Review, 2023). Rich infrastructure, trade and commerce and better job opportunities attract migrants from other states of India. It has the second-highest population of inter-state migrants in the country, only after the state of Maharashtra (Government of NCT, 2023; Khawoosa, 2019).
There are over 13.4 million vehicles occupying space on the roads of Delhi, creating traffic congestion as a common problem (Goswami, 2022). However, it is impacted by various other factors as well, which are as follows:
The city has various modes of public transportation system. They are as follows:
Selecting the right means of transportation in Delhi depend on various factors including the distance, time constraints, cost, convenience and personal preferences. Here are some considerations that help one to choose rightly and could be selective according to what mode of transportation in Delhi is more suitable to them:
Ultimately, the choice of transportation in Delhi depends contextually as per the specific circumstances. It is helpful to stay updated on the latest information about routes, fares and any ongoing changes or disruptions in the transportation system. The hourly updates are available on radio, but they are not consistent and dependable. At the same time, one has to wait for the updates.
The focus is to have collective information about the circumstances and thereby establish the problems a common person in Delhi goes through during their daily travel. The goal is to provide a desirable, user-friendly system to beat the traffic for users of all age groups, social and cultural backgrounds at any time of the day (without any wait). The intention is to make the movement of the daily commuters through the city relatively effortless.
Methodology
The interview was conducted as group participatory approach in 15 rounds with 637 women and girls across 11 districts in Delhi.
Identification of the stakeholders was done keeping in view the following:
It was the requirement of the research study that the researchers spent a substantial time in the field. The study took over 15 months with intensive observation. Kurt Lewin, in his interpretation, mentioned that there is a limitation of studying complex real social events in a laboratory environment. There is always the complexity of splitting the elements of an integrated system, retaining its genuineness in natural condition (Sofer, 1972).
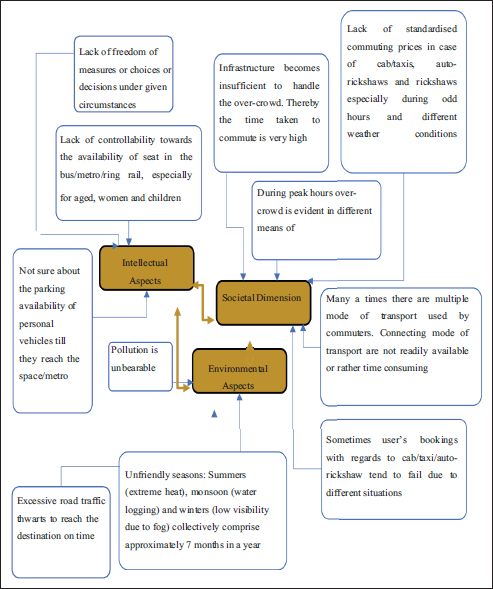
In holistic view of scientific understanding of living systems, all living organisms have a distinctive commitment to contribute to the harmonious functioning of their ecosystem. This understanding of living systems and subsequently human society is grounded in the perception of relations with numerous paradigms of everyday life, largely falling under intellectual aspects, societal dimensions and environmental aspects. Some of the paradigms of everyday life in human society are welfare and entrepreneurial arrangements, education or awareness, culture and lifestyle and motivation, among many others, which together form integrative tendencies. The progressive system of biosphere and subsequently the functioning of human society as a system may be described as holistic view or systemic understanding (Capra & Luisi, 2014).
In a common question, that is, ‘mention three major pain points while commuting’, to all the respondents, the answers/reactions were as follows:
The relationship, pattern and connectedness of these various aspects lead to systemic phenomenon. Capra and Luisi, in their study of systems view of life, observed that recognition of networks of social communication led to systemic understanding of social systems (Capra & Luisi, 2014). The 11 paradigms of undesirable problems or drawbacks mentioned above associated with commuting in Delhi are interconnected and classified as follows in Figure 1.
A comprehensive and multi-faceted approach was taken towards developing a framework that addresses the undesirable problems or drawbacks without any skirmish in the present system. Focus group discussion and brainstorming process were conducted to produce ideas. A number of ideas were obtained in two rounds from a number of people divided in two groups of 11 people. The members in the focus group discussion and brainstorming process included daily commuters through bus, daily commuters through metro rail, daily commuters through personal vehicles, daily commuters through multiple modes of public transport, product service and systems design professionals, academicians in the areas of user interface and user experience and information technologists.
The sole agenda for focus group discussion and brainstorming process was to invite number of ideas, perceptions and opinions so that later they may be evaluated and improved upon (Jones, 1970).
Result
Ideas obtained through focus group discussion and brainstorming process are as follows:
Figure 1. Paradigm of Undesirable Problems or Drawbacks Associated with Intellectual Aspects, Societal Dimension and Environmental Aspects and their Connection with Each Other.
During the process of substantiation of the above ideas with the members, a number of ideas were emphasised upon. They need to be re-assessed and consolidated. It is done keeping in view forming the ideas into systems with various arrangements of multiple elements. Re-assessment of the ideas was done with the application of transformation techniques or removal of mental blocks. Transformation technique can be applied to corroborate ideas or search (Jones, 1970). The transformation technique that is used is as follows:
The conceptualised idea that can be established into interrelated systems is an application operational on any smart phone. It is based on a fact, that is, the number of smartphone users in India will be 1 billion by 2026 as predicted by Deloitte’s 2022 Global Technology, Media and Entertainment, Telecom (TMT) (Press Trust of India, 2023). The top five cities in India raised over 55% of smartphone sales, with Delhi generating the maximum demand (The Hindu, 2018). Against a population of approximately 3.2 crore (32 million) in Delhi, there are over 4.5 crore (45 million) mobile phone connections, and it is increasing fast (PTI, 2012). Figure 2 depicts the conceptualised idea as a system with various system elements.
The application tends to address all the paradigms of undesirable problems or drawbacks associated with intellectual aspects, societal dimension and environmental aspects. The objective was to come up with a holistic solution to all the commuting problems in Delhi.
Some high-fidelity screen images of the application are mentioned below, depicting the interface and the user experience it offers.
Figure 2. The Conceptualised Idea as a System with Various System Elements.
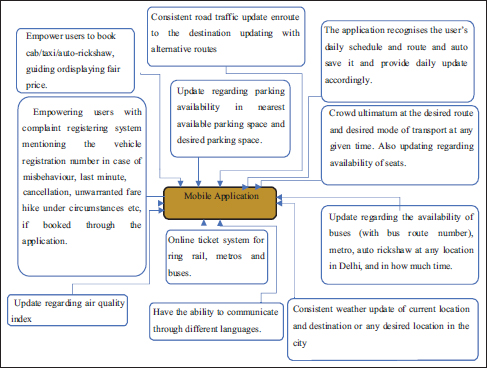
Figure 3. Splash Screen.
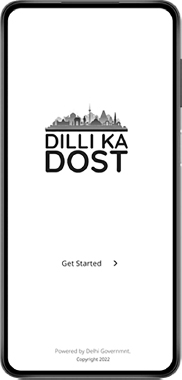
Figure 4. Signing In, Splash Screen.

Figure 5. One-Time Password (OTP) Splash Screen.

Figure 6. Location Permission Screen.
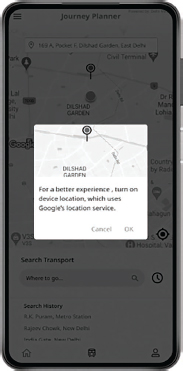
Figure 7. Language Screen.
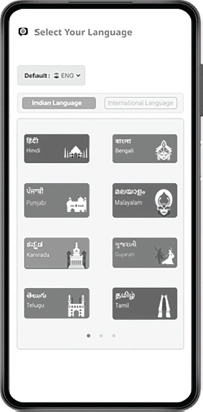
Figure 8. Journey Planner, Home Screen with Traffic Updates.
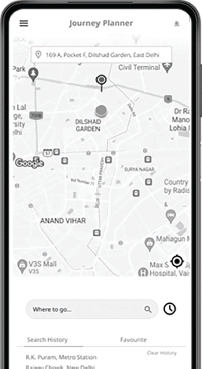
Figure 9. Complaint Registering Screen.
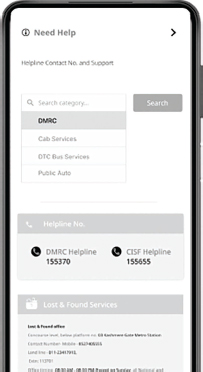
Figure 10. Journey.
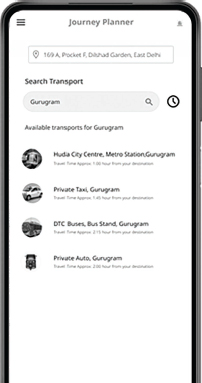
Figure 11. Cab.
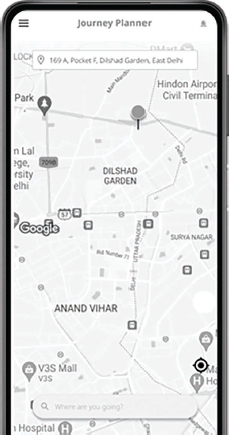
Figure 12. Cab.
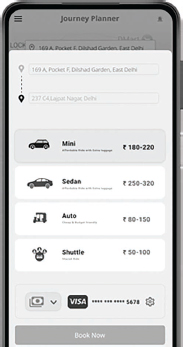
Figure 13. Metro.
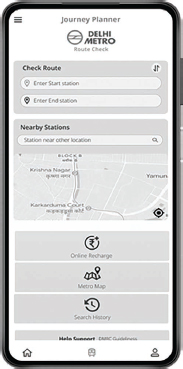
Figure 14. Metro.
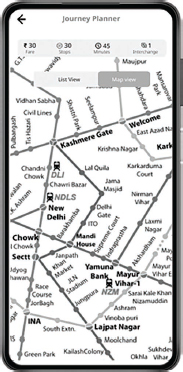
Figure 15. Metro.
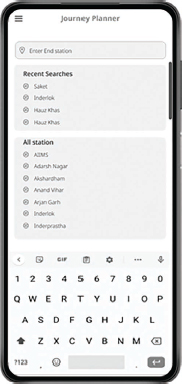
Figure 16. Metro.
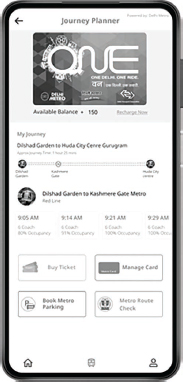
Figure 17. Metro.
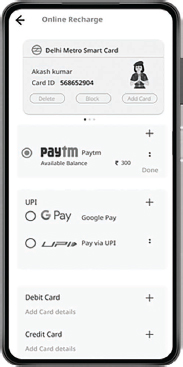
Figure 18. Metro.
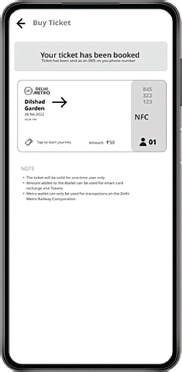
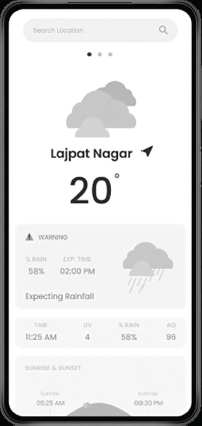
Figure 19. Weather Guide.
Figures 3–10 describe the application’s signing-in process, language options and the journey planner. The application may offer more than 30 language options. Figure 11 and Figure 12 describe the cab booking process.
Figures 13–18 describe the guide for metro train travel within the city, including the rush monitor in selected stations and online ticketing system. Same guide will be available for other mode of public transport as well, for example, ring rail and bus.
Figure 19 is a complete guide to weather updates and air quality index in specific locations in the city.
Conclusion
The entire study was to analyse the problem faced by the population of Delhi while travelling in traffic congestion. The challenges they face while managing their travel because there is uncertainty while commuting. Commuting is not very friendly and rich in experience.
The proposed system offers security, controllability and ease to over 32 million population in Delhi. It is going to be an absolute city commuting guide in all circumstances. It is a replicable model which can be initiated in other cities as well. The interface incredibly enhances the daily commuter’s experience. It may also be noted that the tourists and first timers in the city will be benefitted immensely through the application. With certain infrastructural inclusion in the existing system, for example, close circuit television cameras (CCTV) in buses, parking spaces, metro rails, ring rails and strategic points over the roads, and also being consistently connected with the meteorological department, the proposed system may be launched. These are required to gather minute-to-minute data and further updates.
The proposed system is organised with the potential to save time of the commuters and reduce the amount of fuel burnt [inclusive of diesel, petrol and compressed natural gas (CNG) vehicles] due to idling of vehicles at traffic jams, thereby the annual financial loss incurred due to traffic congestion, which is over $8.5 billion (Financial Express, 2018). The government may initiate it or offer private parties to pitch in, even under schemes like start-up India or make in India.
Acknowledgements
The research is an outcome of the subject ‘Design and Society’ at Fashion and Lifestyle Accessories Department, National Institute of Fashion Technology. The authors are deeply indebted to news agencies—The Hindustan Times, The Financial Express, The Times of India, The Economic Times and The Indian Express. The authors are thankful to all the respondents and focus group experts for their time and efforts.
Declaration of Conflicting Interests
The authors declared no potential conflicts of interest with respect to the research, authorship and/or publication of this article.
Funding
The authors received no financial support for the research, authorship and/or publication of this article.
Adak, B. (2014, December 29). Delhi wastes 40 000 litres of fuel per day in traffic jams. India Today. https://www.indiatoday.in/india/story/delhi-traffic-jams-fuel-wastage-pollution-crri-report-233195-2014-12-28
Agarwal, P. (2022, October 19). Delhi Metro ridership hits 87% of pre-pandemic levels. The Times of India. https://timesofindia.indiatimes.com/city/delhi/metro-ridership-hits-87-of-pre-pandemic-levels/articleshow/94951303.cms#
ANI. (2020, May 19). Only 10% auto-rickshaw ply on roads as Delhi enters lockdown 4.0. Economic Times Auto. https://auto.economictimes.indiatimes.com/news/commercial-vehicle/lcv/only-10-auto-rickshaw-ply-on-roads-as-delhi-enters-lockdown-4-0/75817205
Capra, F., Luisi, P. L. (2014). The systems view of life a unifying vision. Cambridge University Press.
Crawford, R. P. (1954). The techniques of creative thinking. Hawthorn Books.
Delhi Development Authority. (2020). Baseline report transport. Delhi Development Authority and National Institute of Urban Affairs Collaboration. https://dda.gov.in/
Delhi Disaster Management Authority. (2014). Delhi disaster management plan. https://ddma.delhi.gov.in/
Delhi Metro. (2023). Interactive metro map. https://www.delhimetrorail.com
Financial Express. (2018, April 26). Traffic jam in 4 metros costs more than entire Rail budget; this city has worst peak-hour congestion. https://www.financialexpress.com/policy/economy-traffic-jam-in-4-metros-costs-more-than-entire-rail-budget-this-city-has-worst-peak-hour-congestion-1146356/#
Goswami, S. (2021, September 22). Delhi govt to induct only e-autos from now, one-third permits reserved for women. Hindustan Times. https://www.hindustantimes.com/cities/delhi-news/delhi-govt-to-induct-only-e-autos-from-now-one-third-permits-reserved-for-women-101632249134810.html
Goswami, S. (2022). Delhi has 13.4 million registered vehicles, but 42% of them “invalid”. Hindustan Times. https://www.hindustantimes.com/cities/delhi-news/delhi-has-13-4-million-registered-vehicles-but-42-of-them-invalid-101643672914562.html
Government of, NCT. (2023). About district. https://dmsouth.delhi.gov.in/about-district/
Jones, C. J. (1970). Design methods. John Wiley & Sons, Inc.
Khawoosa, V. M. (2019 July 28). Delhi has highest share of inter-state migrants. Hindustan Times. https://www.hindustantimes.com/delhi-news/delhi-has-highest-share-of-inter-state-migrants/story-QCYXSWlnSYAJbNb25ljcPL.html
Mani, G. (2023, February 22). How much are bike taxis used in Delhi? More than you’d think. The Indian Express. https://indianexpress.com/article/cities/delhi/how-much-are-bike-taxis-used-in-delhi-more-than-youd-think-8459198/#
Mathur, A. (2022, December 30). Sharp rise in Delhi Transport Corporation’s ridership, but losses mount due to gap in operating costs and ticket revenues. The Times of India. https://timesofindia.indiatimes.com/city/delhi/sharp-rise-in-delhi-transport-corporations-ridership-but-losses-mount-due-to-gap-in-operating-costs-ticket-revenues/articleshow/96605178.cms#
Osborn, A. F. (1963). Applied imagination. Scribner’s Sons.
Press Trust of India. (2023, July 11). India to have 1 billion smartphone users by 2026: Deloitte report. Business Standard. https://www.business-standard.com/article/current-affairs/india-to-have-1-billion-smartphone-users-by-2026-deloitte-report-122022200996_1.html
PTI. (2012, November 22). Cell phone use in Delhi increasing at an incredible rate. The Economic Times. https://economictimes.indiatimes.com/cell-phone-use-in-delhi-increasing-at-an-incredible-rate/articleshow/17323423.cmsfrom=mdr
PTI. (2023, January 2). Eighty per cent of Delhi’s bus fleet will run on electric by 2025: CM Arvind Kejriwal. The Economic Times. https://economictimes.indiatimes.com/industry/renewables/eighty-per-cent-of-delhis-bus-fleet-will-run-on-electric-by-2025-cm-arvind-kejriwal/articleshow/96677908.cmsfrom=mdr
Saini, A. (2015). Case study of cycle rickshaw on ergonomic basis. International Journal of Advanced Research in Engineering and Applied Sciences, 4(9), 55–66.
Saiyad, G., Minal Kumar, R., Dipak Rathwa, D. (2019). Trips generated by rickshaw pullers and trip rate for cycle rickshaws: A case study of Delhi. Transportation Research Procedia, 48, 2296–2312.
Sofer, C. (1972). Organizations in theory and practice. Heinemann.
The Hindu. (2018, January 20). Top 30 cities make up 51% of smartphone market; Delhi tops tally. Business Line. https://www.thehindubusinessline.com/info-tech/top-30-cities-make-up-51-of-smartphone-market-delhi-tops-tally/article64339099.ece#
World Population Review. (2023). World population by country. https://worldpopulationreview.com/
