IIFT International Business and Management Review Journal

 Search
Arnob Paul1  and Sushanta Kumar Nayak1
1Department of Economics, Rajiv Gandhi University, Itanagar, Arunachal Pradesh, India

Creative Commons Non Commercial CC BY-NC: This article is distributed under the terms of the Creative Commons Attribution-NonCommercial 4.0 License (http://www.creativecommons.org/licenses/by-nc/4.0/) which permits non-Commercial use, reproduction and distribution of the work without further permission provided the original work is attributed.
This article examines the trends and composition of services trade within South Asia, a region with substantial potential yet lagging behind its global counterparts. The study highlights the increasing importance of the services sector globally, with its share in world gross domestic product (GDP) rising to 65.7% by 2020, and its contribution to employment reaching 51% of the global workforce. South Asia, comprising eight countries, demonstrates diverse patterns in services trade, with India leading as a major player, contributing 3.77% to the global services trade in 2021. The analysis reveals variations in service distribution across nations and over time, with significant portions of manufacturing services in India and Bhutan, transport services dominating in Nepal and Pakistan, and travel services prevalent in Bhutan and the Maldives. Also, financial services are notable in Afghanistan and Bhutan, while Pakistan excels in insurance and pension services. Despite the challenges, including negative growth during economic downturns and the COVID-19 pandemic, South Asia has witnessed steady growth in the services trade, led by India and the Maldives. This study shows the region’s growing integration into the global service economy and its evolving trade dynamics.
South Asia, services trade, growth rate, import composition, export composition
Background
Services play a crucial role in shaping a country’s economic scenario, enhancing the efficiency of various industries and the nation as a whole. Key services such as transportation, telecommunications and financial services influence the movement of people, goods, services and capital across borders (Maurer et al., 2008). After experiencing a decline in its contribution to global gross domestic product (GDP) in terms of value added in 2011, the services sector has seen significant growth. By 2020, its share of the global GDP reached approximately 65.7%. Also, the global trade in services, as a percentage of world GDP, has more than doubled from 6% to 13.6% between 1990 and 2019. The rapid expansion of the services sector has also increased its capacity to absorb labour. According to data from the International Labour Organization (ILO) via ILOSTAT, around 51% of the global workforce is employed in the services sector. This data reveals a substantial rise of about 17% in the share of global employment in services from 1991 to 2019.
The services sector is dominating the global economy in the present era. International trade and investment in services is gaining importance in the global platform. In the year 2020, the share of the services sector value added in the world GDP was around 65.3% (Organisation for Economic Co-operation and Development (OECD) National Accounts Database). In the case of India, the services sector has also received the highest foreign direct investment (FDI) during 2021 (Paul & Nayak, 2024). As part of the Uruguay Round Commitments in the World Trade Organization (WTO) in the 1990s, over the last two to three decades, many countries have liberalised and integrated into the global market and expanded their services trade dimension; also, their participation in regional trade agreements (RTAs) increased dramatically in the 2000s. Earlier, due to the non-storability and simultaneity of production and consumption nature, the services were considered to be non-tradable. It is only after the Uruguay Round of the WTO General Agreement on Trade in Services (GATS) in 1994 that trade in services has come into the focus of mainstream economists. The momentum for incorporating services into RTAs gained traction when the services dimension was included in the North American Free Trade Area (NAFTA) in 1994 (Paul & Nayak, 2025a).
For the last three decades, the trade in services has been becoming an attractive matter of discussion among researchers. Due to some reasons, such as the faster growth of services trade in comparison to merchandise trade and the continuously increasing share of the services sector in GDP and employment, the studies on trade in services have gained significant importance. The United Nations Conference on Trade and Development (UNCTAD) data indicate that the value of world export of goods has increased at a compound annual growth rate (CAGR) of 22.93%, as against the world services export, which has grown at a CAGR of 23.67% during the period from 2005 to 2021. Also, the share of the services sector in world GDP has increased from 55.4% to 63.9% in 2021 (according to World Bank national accounts).
South Asia consists of eight countries: Afghanistan, Bangladesh, Bhutan, India, the Maldives, Nepal, Pakistan and Sri Lanka. In terms of the value of total services trade, India is the leading member country among all the South Asian Association for Regional Co-operation (SAARC) members, with a total services trade (services import + services export) of around $436,613 million (in 2021), which is around 3.77% of the total world services trade (which is $11,591,791 million in 2021). It is an important region having a lot of potential in services trade lagged behind the global economy. Therefore, looking at the rising importance of the services sector in the field of trade, employment and growth of the nation, in this article, the trend of services export, services export composition and direction of the services trade of South Asian countries are analysed.
Review of Literature
A vast body of theoretical literature explores the differences between trade in services and trade in goods. One key distinction is that, unlike goods, services cannot be stored. As a result, their production and consumption occur simultaneously, requiring both producers and consumers to be present in the same location at the same time (Hill, 1977).
In this regard, Deardorf (1985) argued that the application of the traditional theory of revealed comparative advantage is, therefore, not applicable to trade in services, or it needs some modifications. Further, Mirza and Nicoletti (2004) stated that due to the feature of joint production and consumption, inputs from exporters and importers will be required to trade a service.
Another branch of authors has focused on the similarities that exist between the trade in goods and trade in services. Hindley and Smith (1984) argued that there is no difference in the theoretical approach to the study of trade in goods and trade in services. Further, Bhagwati et al. (2004) pointed out that the gains from trade in services can be understood using the theoretical framework used for gains from trade in goods. Markusen (1989) stated that producer services have similar characteristics, such as differentiated products and scale economies, to goods and services. Indeed, Markusen employed the same monopolistic competition model to examine trade in both producer services and manufactured intermediate goods.
Over the past decade, empirical research on services trade has expanded significantly. However, unlike the trade-in-goods literature, which benefits from detailed micro-level data, these studies primarily rely on country-level or aggregate industry-level data on services trade (e.g., Freund & Weinhold, 2002; Head et al., 2009; Kimura & Lee, 2006; Paul & Nayak, 2025b). Interestingly, the findings of these studies often mirror those in goods trade research. For instance, both Kimura and Lee (2006) and Head et al. (2009) apply similar specifications to analyse goods and services trade, revealing comparable trade elasticities. Also, they highlighted that common factors in gravity models of goods trade—such as a shared language or colonial history—also play a significant role in facilitating services trade.
These reviews of literature highlight that there are very limited studies on the modelling issues of services trade. Further, most of the studies are centred on the definitional issues of services trade and the measurement of services trade. Since a low pool of data is available on trade in services, it is difficult to conduct a micro-level study encompassing the disaggregated level of services. This study is done with the objective of highlighting some stylised facts on the trend and composition of the services trade of the South Asian countries.
Methodology
Data
In this study, the OECD–WTO Balanced Trade in Services (BaTIS) data set has been used. This data set covers three main variables, that is, reported value (reported by the reporting country), reported value including estimates (in addition to the reported values, any adjustments were made to ensure internal consistency, as well as the estimations made by the OECD–WTO to fill in the gaps in the reported information), and final balanced value (it is the reconciled bilateral trade flow, where exports equal mirror imports). For the analysis of the trend and composition of services trade flows, the data on reported value, including estimates, have been used; while for the direction of services trade of South Asian countries, the data on final balanced value have been used. The OECD–WTO BaTIS data set has been used because of its two advantages, that is, (a) it is complete and consistent, and (b) it is balanced in the sense that the asymmetries between reported and mirror flows, exports and imports, are reconciled by calculating a symmetry-index weighted average between the two. Since the final balanced values are estimated in nature, this data are used for bilateral analysis. This study is done for the period from 2005 to 2021.
Tool for Trend Analysis
For trend analysis, the annual growth rate (AGR) and CAGR are calculated. Moreover, the linear regression analysis is used to determine the changing trend of the export services, import services and total trade in services.
The CAGR is determined using the following formula (Formula 1).
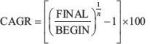 (1)
(1)
Note: FINAL is the final value, BEGIN is the end value, and n is the number of periods.
Tools for Analysing Structural Change in Composition of Services Trade
Services exports, imports and total trade for different services are given a rank (the category of service having the highest share in the total services exports was given rank 1 and so on) for the initial period (2005) and the end period (2021) (Except Afghanistan, 2008–2020 and Bhutan, 2006–2020). The Spearman rank correlation coefficient (Spearman, 1904) has been calculated using Formula 2. A significant positive correlation will indicate that there is no significant change in the composition of services exported to India during the study period. On the other hand, an insignificant positive correlation will indicate that there is a significant change in the composition of services exported to India.
 (2)
(2)
Note: D2 is the square of rank differences. mk is the number of items obtaining the same rank. And n is the number of observations.
The Spearman’s rank correlation coefficient will help in knowing if there has been any change in the composition of services exports, imports and total trade of South Asian countries during the period from 2005 to 2021.
Results and Discussion
Trend of Services Export of South Asia
The trend of South Asian services exports, with and without Afghanistan, is shown in Table 1 for the years 2002–2021. The data show that global service exports have increased significantly over time, going from $1,632.34 billion in 2002 to $6,033.03 billion in 2021. Service exports from South Asian countries have increased significantly during this time, with and without Afghanistan. South Asian exports have climbed from $24.71 billion in 2002 to $261.63 billion in 2021 without taking Afghanistan into account. South Asian exports, including Afghanistan, varied from $24.71 billion in 2002 to $261.63 billion in 2021.
Based on an analysis of growth rates, the South Asian countries have experienced a remarkable change in their service exports, with an average CAGR of 13.22% when Afghanistan is included, and 5.28% when it is not. This growth is faster than the average growth rate for services exports globally, which were 2.01% and 7.12%, respectively.
The percentage of South Asian Free Trade Area (SAFTA) exports to global exports is also shown in Table 1. South Asia’s proportion of global exports has risen over time, suggesting an expanding footprint in the services sector. For example, in 2002, South Asia’s exports without Afghanistan made up 1.51% of global exports; by 2021, that percentage had increased to 4.34%. Similarly, South Asian exports rose from 1.51% of global exports in 2002 to 4.34% in 2021, including Afghanistan.
In summary, the world export of services has increased by more than 3.5-fold from $1,632 billion in 2002 to $6,033 billion in 2021. The CAGR of the world services export growth for the period from 2002 to 2021 is more than 23.14%. But, in the case of South Asian (without Afghanistan) exports, the CAGR is more than 28%. Further, the share of South Asian exports in total world exports has increased tremendously during the study period (2002–2021). During 2002, the share of services exports of South Asia as a whole was just 1.51% of world exports, which increased to 3.30% in 2009 and to 4.34% in 2021. The share declined from 2.89% in 2008 to 2.82% in 2009, but again jumped back to 3.30% in 2010. This is the biggest-ever change in the share of the services exports of
Table 1. Trend of Services Export of South Asia.
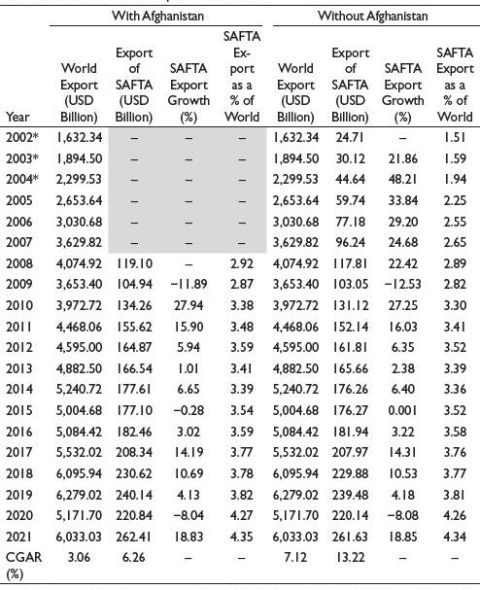
Source: Calculated from the data of Organisation for Economic Co-operation and Development (OECD)–World Trade Organization (WTO) Balanced Trade in Services (BaTIS) data set.
Notes: Shaded parts represent the unavailability of data. *International Trade Centre (ITC) Trade Map. SAFTA: South Asian Free Trade Area.
South Asia, followed by the period of COVID-19 in 2020. During this period, the share of services exports by South Asia has increased to 4.35% in 2021 from 3.81% in 2019.
Trend of Services Import of South Asia
Table 2 presents data with and without Afghanistan’s inclusion, illustrating the trend of services imports within South Asia from 2002 to 2021. The data are separated into two sections: one with import figures from Afghanistan and the other without.
The overall amount of services imported into the world has been steadily rising over time, a sign of the services’ increasing importance in international trade. The import data within South Asia also show an increasing trend, though with some fluctuations. The SAARC bloc’s (together with South Asian countries) import values show significant growth rates, particularly from 2008 onward, indicating a rise in regional co-operation and trade.
Table 2. Trend of Services Import of South Asia.
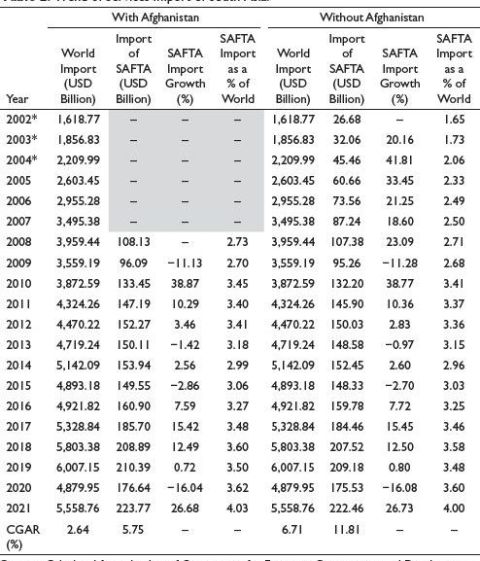
Source: Calculated from the data of Organisation for Economic Co-operation and Development (OECD)–World Trade Organization (WTO) Balanced Trade in Services (BaTIS) data set.
Notes: Shaded parts represent the unavailability of data. *International Trade Centre (ITC) Trade Map. SAFTA: South Asian Free Trade Area.
Table 2 shows the growth percentages of South Asia’s imports with and without Afghanistan, throwing light on how South Asia is doing in terms of service trade. Remarkably, there have been years with negative growth rates, like those of 2009 and 2015, which could have been caused by changes in trade patterns or possible economic difficulties. The CAGRs for South Asia’s imports, however, generally demonstrate encouraging patterns, underscoring the general growth of the services trade within South Asia. Further, it shows the trend of import services of South Asia compared to world imports, implying its share in the global services trade market. The data show that this percentage has fluctuated over time due to several factors, including changes in policy, the state of the economy, and the dynamics of external trade. The general trend of Table 3 points to a growing degree of regional integration and collaboration among countries, as evidenced by the positive trajectory of services trade within South Asia. However, obstacles like negative growth rates in some years and insufficient data in Afghanistan draw attention to the subtleties and complexity of the regional trade environment.
In short, the world import of services has increased by more than 3.4-fold from $1,618.77 billion in 2002 to $5,558.76 billion in 2021. The CAGR of the world services imports for the period from 2002 to 2021 is more than 22%. But, in the case of South Asia (without Afghanistan) imports, the CAGR is more than 27.67%. The share of South Asian imports in total world imports has increased tremendously during the study period (2002–2021). During 2002, the share of services imports of South Asia as a whole was just 1.65% of the world’s exports, which increased to 2.68% in 2009 and to 4% in 2021.
Percentage Share of South Asian Countries in South Asian Trade
The percentage share of each nation in the total South Asian trade, broken down by exports and imports, is shown in Table 3 from 2002 to 2021. Based on the data, it is clear that India has maintained a significant share of both imports and exports over the years, maintaining its dominant position in South Asian trade. India plays a major role in regional trade flows because of its sizeable economy and varied industrial base. Though the share of Pakistan is smaller than that of India, it is remarkable, indicating the importance of Pakistan as another important South Asian economy.
Another important participant in South Asian trade is Bangladesh, which has been gradually gaining ground over time, especially in exports. Bangladesh’s growing influence in regional trade is driven by the growth in communications and professional services (Kathuria & Malouch, 2016). The degree to which Nepal, Sri Lanka and the Maldives participate in South Asian trade varies as well; these countries’ contributions are a reflection of their unique trade and economic policies. Despite fluctuations over time, Nepal’s share in South Asian trade remains modest, given the country’s landlocked status and infrastructure and connectivity challenges. Despite having a lower share of South Asian trade due to its reliance on tourism and fishing, the Maldives nevertheless contributes to the dynamics of the region as a whole.
Table 3. Percentage Share of Countries in Total South Asian Trade.
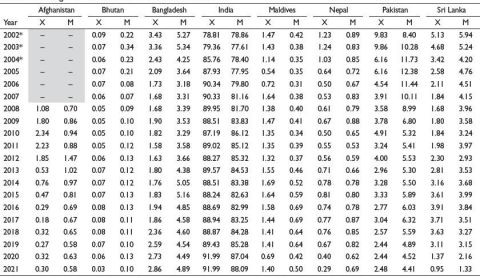
Source: Calculated from the data of Organisation for Economic Co-operation and Development (OECD)–World Trade Organization (WTO) Balanced Trade in Services (BaTIS) data set.
Notes: 1. X represent export. 2. M represents import. 3. Shaded parts represent the unavailability of data. *International Trade Centre (ITC) Trade Map.
Compared to other countries, the contribution of Bhutan to South Asian trade is negligible, which is indicative of its smaller economy and narrow export base, which is mainly concentrated in agricultural and hydropower goods. Table 3 represents the percentage share of different member countries of South Asian in the total trade of South Asia. Looking at the data, it can be said that India is the largest contributor to the total export and total import of South Asia. India’s share in the total services exports of South Asia has increased from 78.81% in 2002 to above 90% in 2007; however, this has declined to 89.95% in 2008 and continued to fall till 2010 (87.19%). However, this has increased to around 92% in 2021.
A similar pattern is seen in the case of service imports during the period from 2002 to 2021. Here also, among all South Asian members, India is the major importer of services. From a 78.86% share in 2002, it has increased to more than 88% in 2021. After India, Bangladesh has a share of around 2.86%, followed by Pakistan with 2.48%, and the Maldives with 1.40% in total South Asian imports of services in recent times (2021). In the case of imports also, Bangladesh is having the second-highest share in services imports with 4.89%, followed by Pakistan with 4.41%, in total South Asian imports in 2021. Maldives’s share in total South Asian imports is much less, around 0.50%.
A significant change in the share of imports and exports of services for Sri Lanka is observed from 2019 to 2021. Sri Lanka had a comparatively good share of around 3.11% in South Asian exports in the year 2019, which has declined to 1.37% in 2020 and 0.95% in 2021. This may be because Sri Lanka is a country dependent on the tourism sector, the sector which was severely affected in 2020 due to COVID-19. Thus, the share in total exports of services has fallen.
Growth of Services Export and Import of South Asian Countries
Table 4 and Table 5 provide insights into the growth of service exports and imports among South Asian nations over time, highlighting distinct patterns across the regions. Table 4 tracks the yearly increase in service exports for each South Asian member, as well as the global total, showing changes in export volumes relative to the previous year. The data reveal a consistent upward trend in service exports, with notable year-on-year growth fluctuations reflecting varying economic conditions and trade dynamics within the region. Complementing this, Table 5 details the CAGR of service exports from 2008 to 2020, alongside the AGRs of service imports from 2009 to 2020.
There are discernible patterns in the export of services amongst South Asian nations from 2003 to 2021. Despite small fluctuations, India’s service exports have grown consistently and significantly, with an average CAGR of 14.15% from 2002 to 2021. India’s impressive track record of growing service exports over the years makes it stand out in the South Asian region. CAGR of 14.15% from 2002 to 2021 on average, the service sector in India has been a major contributor to the country’s economic growth. India’s proficiency in several service sectors, including software development, financial services, business process outsourcing, and information technology (IT), is demonstrated by this steady growth.
Table 4. Growth of Export of Services of South Asian Countries (Per Cent).
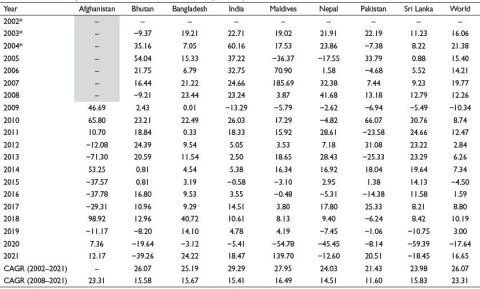
Source: Calculated from the data of Organisation for Economic Co-operation and Development (OECD)–World Trade Organization (WTO) Balanced Trade in Services (BaTIS) data set.
Notes: Shaded parts represent the unavailability of data. *International Trade Centre (ITC) Trade Map. CAGR: Compound annual growth rate.
Table 5. Growth of Services Import of South Asian Countries (%).
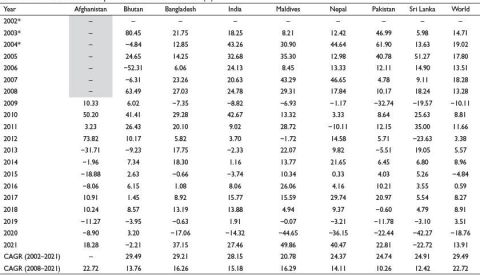
Source: Calculated from the data of Organisation for Economic Co-operation and Development (OECD)–World Trade Organization (WTO) Balanced Trade in Services (BaTIS) data set.
Notes: Shaded parts represent the unavailability of data. *International Trade Centre (ITC) Trade Map. CAGR: Compound annual growth rate.
Significant growth in service exports is also shown by other nations, like Sri Lanka and Bangladesh, which had CAGRs of 7.12% and 12.13% over the same period, respectively (supported by Sadiq et al., 2023). Bangladesh’s steadily increasing service exports are indicative of the nation’s expanding service-oriented economy. Even with a slower growth rate than Bangladesh and India, Sri Lanka continues to have positive growth in service exports consistently. On the other hand, Afghanistan’s growth in services exports fluctuated over time, showing both positive and negative growth rates. Bhutan exhibits variations as well, growing positively in some years and negatively in others.
Afghanistan’s imports of services fluctuated, showing a significant increase in 2010 and subsequent declines thereafter (until 2016); however, it experienced positive growth during 2017 and 2018 and again experienced negative growth during 2019 and 2020. Bhutan has continuously shown positive growth rates, which suggests that service imports have increased steadily over time and have aided in the country’s economic development. Bangladesh’s growing services sector was reflected in its robust growth in services imports, especially in 2010 and 2011. Despite occasional swings, India, a significant economy in the area, has managed a comparatively stable growth in services imports.
Services imports into the Maldives were highly volatile, declining sharply in both 2013 and 2020. These fluctuations may have been caused by shifts in tourism trends or general economic conditions. Nepal’s imports of services have exhibited erratic patterns, with some years seeing increases and others seeing decreases, reflecting the country’s changing economic climate. Services imports into Pakistan have fluctuated, with a notable drop in 2009, possibly as a result of policy changes or economic difficulties. Sri Lanka’s erratic economic performance over the period was reflected in the country’s services imports, which likewise displayed mixed trends, with some years of growth and others of decline.
For every country, the CAGR from 2008 to 2020 offers a concise indicator of the general trend in services imports. Bhutan’s CAGR of 7.64% was the highest during the study period, indicating consistent growth in services imports. Bangladesh’s CAGR of service imports stands out to be 6.64%. Other nations, like the Maldives and India, had moderate CAGR values, indicating a slower rate of growth in the import of services.
In brief, it reveals that the Maldives has the highest CAGR of 12.87% from 2002 to 2021. After the Maldives, India has experienced the highest growth, with a CAGR of 12.46%, followed by Bangladesh (11.37%) and Nepal (10.36%). Pakistan, Bhutan and Sri Lanka have a CAGR of 8.08%, 7.13% and 3.33%, respectively. The services import data of Afghanistan are not available from 2002 to 2007 and 2021; thus, we could not fetch the CAGR for the same from 2002 through 2021. For the same period from 2002 to 2021, the CAGR of the world’s services import was 6.71%.
Country-wise Share in Services Trade in World Trade
Table 6 shows the percentage of South Asian nations’ global trade share from 2002 to 2021, broken down by imports (M) and exports (X). Afghanistan, Bhutan, Bangladesh, India, the Maldives, Nepal, Pakistan and Sri Lanka are among the nations that are represented.
India has steadily held a major portion of the global trade over the years. India’s import share was slightly higher at 1.30% in 2002 than its export share of 1.19%. India’s export and import shares grew over the ensuing years, indicating the country’s expanding involvement in international trade. India’s import share was 2.90% in 2011, while its export share had increased to 3.10%. Bangladesh’s trade shares also showed a discernible increase over time. Bangladesh’s import share was 0.09% in 2002, while its export share was 0.05%. These numbers had risen to 0.12% and 0.20%, respectively, by 2011. Bangladesh’s consistent increase in trade share is a sign of improving market integration.
Throughout that time, Sri Lanka’s trade shares stayed largely steady. Sri Lanka’s import share in 2002 was 0.10%, whereas its export share was 5.13%. Sri Lanka’s export percentage steadily declined over time, hitting 0.95% in 2021. In the meantime, Sri Lanka had a trade surplus, as seen by its fluctuating but generally low import share. Compared to the other South Asian countries, Afghanistan, Bhutan, the Maldives and Nepal typically had very small shares in global trade. For the majority of the years, their trade shares have stayed below 1%, which is indicative of their smaller economies and lower levels of integration into international trade networks.
In short, with time from 2002 to 2021, the share of services exports of India has increased from 1.19% in 2002 to around 4% in 2021. Similarly, India’s share in world imports has increased from 1.30% in 2002 to 3.53% in 2021. Between 2014 and 2018, Sri Lanka’s share in world exports was higher than that of India, but in 2019, India surpassed Sri Lanka, and eventually, in 2020 and 2021, the share of Sri Lanka in total world services exports fell to 1.37% and 0.95%, respectively. The other countries had a consistently low share in the world services exports and were not impacted much by the global slowdown of 2008 and the COVID-19 pandemic of 2020. The import figures show that India is the leading importer of services, having a share of more than 3.50% in recent times (2021).
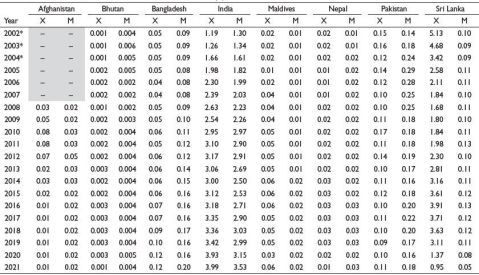
Composition of Services Trade of South Asia
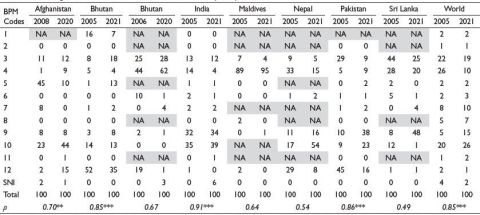
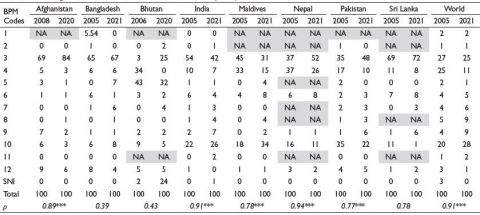
The percentage of different services in total services exported (/imported) from (/to) Afghanistan, Bhutan, India, the Maldives, Nepal, Pakistan, Sri Lanka, and worldwide from 2005 to 2021 is shown in Table 7 and Table 8. Over time, a significant shift is observed in the trend of services trade. Interestingly, there is a strong association, showing steady trends over time, between the total amount of services exported and imported. The brief country-wise analysis is presented below:
The data on services exports across South Asian countries reveal significant trends and transformations over time. India, as a leader in telecommunications, computer and information services, consistently shows a high contribution from these sectors, reflecting its global competitiveness in IT. However, sectors like transport and travel have witnessed a declining share in India’s exports, indicating a shift towards more technology-driven services. Bhutan, on the other hand, showcases a starkly different profile, with travel and transport services comprising over 90% of its total services exports. This emphasises Bhutan’s reliance on tourism and cross-border transport as economic pillars, while its financial services
Table 6. Share of South Asian Countries in World Services Trade (%).
Source: Calculated from the data of Organisation for Economic Co-operation and Development (OECD)–World Trade Organization (WTO) Balanced Trade in Services (BaTIS) data set.
Notes: 1. X represents export. 2. M represents import. 3. Shaded parts represent the unavailability of data. *International Trade Centre (ITC) Trade Map.
Table 7. Percentage Share of Various Services in Total Services Export by Countries.
Source: Calculated from the data of Organisation for Economic Co-operation and Development (OECD)–World Trade Organization (WTO) Balanced Trade in Services (BaTIS) data set.
Notes: 1. *** and ** represent statistically significant at 1% and 5% level respectively. 2. ρ denotes the Spearman correlation coefficient. 3. SNI denotes service not included. 4. NA denotes services not available. Balance of payments manual (BPM) codes: 1. Manufacturing services; 2. Maintenance and repair services N.I.E.; 3. Transport services; 4. Travel services; 5. Construction services; 6. Insurance and pension services; 7. Financial services; 8. Charges for the use of intellectual property N.I.E.; 9. Telecommunications, computer and information services; 10. Other business services; 11. Personal cultural and recreational services; 12. Government goods and services N.I.E.
Table 8. Percentage Share of Various Services in Total Services Import by Countries.
Source: Calculated from the data of Organisation for Economic Co-operation and Development (OECD)–World Trade Organization (WTO) Balanced Trade in Services (BaTIS) data set.
Notes: 1. ***Denotes significant at a 1% level. 2. ρ denotes the Spearman correlation coefficient. 3. SNI denotes service not included. 4. NA denotes services not available for trade. Balance of payments manual (BPM) codes: 1. Manufacturing services; 2. Maintenance and repair services N.I.E.; 3. Transport services; 4. Travel services; 5. Construction services; 6. Insurance and pension services; 7. Financial services; 8. Charges for the use of intellectual property N.I.E.; 9. Telecommunications, computer and information services; 10. Other business services; 11. Personal cultural and recreational services; 12. Government goods and services N.I.E.
sector has shown significant growth recently. In the Maldives, travel services dominate, contributing over 90% of the total services exports, underscoring its heavy dependence on the tourism industry, complemented by modest contributions from transport services and emerging telecommunications exports.
Nepal and Pakistan display diversified trends in their services export mix. Nepal has experienced a surge in ‘other business services’, which now account for over half of its total exports, while traditional sectors like travel have seen fluctuations due to external shocks like the COVID-19 pandemic. Pakistan mirrors a similar trajectory, with notable growth in telecommunications and a declining share in government goods and transport services. Sri Lanka, like Nepal and Pakistan, exhibits a rising reliance on telecommunications and computer services, while traditional sectors like transport and travel remain significant. Afghanistan, which is constrained by limited data, reveals a transition from the construction services dominance to a growing share of ‘other business services’. Across these countries, the evolving export profile indicates shifts towards specialised and technology-driven services, influenced by both global trends and domestic economic strategies.
The patterns of service imports across South Asian countries from 2005 to 2021 reveal varied and evolving trends, reflecting each country’s economic priorities and dependencies. Afghanistan’s reliance on transport services dominates its imports, with a consistently high share increasing to 83.8% in 2020. This highlights the critical role of transportation in its trade and logistics infrastructure. Similarly, transport services are a major focus for Bangladesh, accounting for over 65% of its imports throughout the period, while sectors like financial and other business services have seen modest growth. Bhutan’s service imports also emphasise transport, but the rise in travel and telecommunications services points to shifting priorities towards tourism and technological infrastructure. For India, the growing share of computer, information and telecom services demonstrates its deepening integration into global digital networks, complementing its reliance on transport and travel services, despite these traditional categories showing a slower growth rate.
The Maldives and Nepal exhibit unique service import patterns that mirror their distinct economic structures. In the Maldives, imports of travel and telecom-related services have increased significantly, signalling a shift in consumption patterns, likely tied to its dependence on tourism and the growing importance of digital connectivity. Nepal, on the other hand, shows a broadening in its import composition, with significant increases in transport, construction, and technology-related services over time. This diversification suggests a reorientation of Nepal’s economic focus, possibly towards infrastructure and technological development. Meanwhile, Pakistan’s services imports highlight a decline in traditional sectors like manufacturing, with notable growth in travel, insurance, and other business services. This indicates a dynamic shift, even though the structural changes in its import pattern appear statistically insignificant over time.
Sri Lanka’s services import situation shows a transition towards sectors like financial services and telecommunications, where rapid increases reflect shifting economic activity and priorities. Across the region, the positive correlations in services import patterns, though varying in significance, highlight steady trends shaped by domestic needs and global interdependencies. Collectively, these trends not only reflect the economic transformations within individual countries but also shed light on the evolving trade dynamics that influence the broader regional landscape.
Therefore, the patterns of service exports and imports across South Asian countries reveal both commonalities and contrasts in economic priorities. Manufacturing services are significant in exports from Bhutan and India and imports by Bangladesh and India, though the shares vary over time. A minimal presence of maintenance and repair services (N.I.E.) is evident across both categories. Travel services dominate exports from Bhutan and the Maldives, reflecting tourism’s reliance, while imports of these services are prominent in Nepal and the Maldives. Transport services are key to exports from Nepal and Pakistan and imports to Afghanistan, Bangladesh and Nepal, indicating logistics’ importance. Construction services feature in Bhutan’s exports and the Maldives’ imports, while financial services are exported by Afghanistan and Bhutan and imported heavily by Afghanistan, Bangladesh and Nepal. Insurance and pension services are notable in Pakistan’s exports and Bangladesh’s imports. Intellectual property (IP) (N.I.E.) fees differ, with Bhutan and Sri Lanka leading in exports, while Bangladesh and Nepal dominate imports. Telecommunications, computer and information services are critical in both exports (Bhutan, Pakistan) and imports (Bangladesh, Bhutan, Sri Lanka), showcasing digital growth. Other business services are significant in exports and imports for Bangladesh, India and Pakistan. These trends highlight evolving trade dynamics and regional economic interdependencies.
Summary and Conclusion
There are various differences in the way services are distributed between the years and between the countries. Significant portions of manufacturing services are found in nations like Bhutan and India, though the percentages change over time. While transport services are notably present, particularly in Nepal and Pakistan, maintenance and repair services (N.I.E.) are minimally represented in most countries. Bhutan and the Maldives are home to a large concentration of travel services, whereas Bhutan has a larger share of construction services (Nath & Goswami, 2018; Singh & Kumar, 2014). While financial services are noteworthy in Afghanistan and Bhutan, insurance and pension services are well-represented in Pakistan. Different countries charge different amounts for the use of IP (N.I.E.), with Bhutan and Sri Lanka charging higher percentages. Information, computer and telecommunications services are widely used in Bhutan and Pakistan.
Despite the negative growth in 2009, 2020 and 2019, the overall services trade within South Asia showed an upward trend from 2002 to 2021. Sri Lanka experienced a significant decline in its share of South Asian exports, falling from 3.11% in 2019 to 0.95% in 2021, most likely as a result of its heavy reliance on tourism, which was negatively impacted by the COVID-19 pandemic. India led the South Asian countries in service export growth rates (CAGR) from 2002 to 2021, with a CAGR of 13.33%. The Maldives came in second with a CAGR of 13.93%, and Bangladesh came in third with a CAGR of 11.67%. Pakistan and Sri Lanka lagged behind the global services trade CAGR of 6.92% (supported by Agarwal, 2019; Chanda, 2010; Sadiq et al., 2023).
In the global services market, India stands out as a leader, displaying steady services export growth with an average CAGR of 14.15% from 2002 to 2021, followed by the Maldives (with a CAGR of 12.94%). Looking at the imports, the Maldives has the highest CAGR of 12.87% from 2002 to 2021. After the Maldives, India has experienced the highest growth with a CAGR of 12.46%, followed by Bangladesh (11.37%) and Nepal (10.36%).
India and Bhutan both have sizeable percentages of manufacturing services, though these figures change over time. While transport services are particularly well-developed in Nepal and Pakistan, maintenance and repair services (N.I.E.) are poorly represented in the majority of other nations. There are notable concentrations of travel services in Bhutan and the Maldives, with Bhutan having a larger stake in construction services. Afghanistan and Bhutan are important for their financial services, while Pakistan has a strong representation in insurance and pension services. Use fees for IP vary from country to country; higher fees are levied in Bhutan and Sri Lanka. In Bhutan and Pakistan, the use of computers, information and telecommunication services is widespread.
On the other hand, the distribution of imported services differs greatly between nations and years. Bangladesh and India are the two countries where manufacturing services are most common, though the percentages change over time. The majority of countries, except Nepal and the Maldives, have very little maintenance and repair services (N.I.E.). Travel services are more common in the Maldives and Nepal, whereas transport services are more common in Afghanistan, Bangladesh and Nepal. Afghanistan, Bangladesh and Nepal are important hubs for financial services, with Bangladesh and Pakistan seeing particularly strong growth in insurance and pension services. There are significant differences in IP fees; Bangladesh and Nepal typically charge more. There are significant percentages of computer, information and telecommunication services in Bangladesh, Bhutan and Sri Lanka.
Declaration of Conflicting Interests
The authors declared no potential conflicts of interest regarding the research, authorship and/or publication of this article.
Funding
The authors received no financial support for the research, authorship and/or publication of this article.
ORCID iD
Arnob Paul https://orcid.org/0000-0002-8324-5948
Agarwal, P. (2019). South Asia: Formulating services sector policies for development, a policy perspective. United Nations Economic and Social Commission for Asia and the Pacific (ESCAP) South and South-West Asia Office.
Bhagwati, J., Panagariya, A., & Srinivasan, T. N. (2004). The muddles over outsourcing. Journal of Economic Perspectives, 18(4), 93–114.
Chanda, R. (2010). Integrating services in South Asia: Trade, investment, and mobility. Oxford University Press.
Deardorf, A. (1985). Comparative advantage and international trade and investment in services. In Trade and investment in services: Canada/US perspectives (pp. 39–71). Ontario Economic Council.
Freund, C., & Weinhold, D. (2002). The internet and international trade in services. American Economic Review, 92(2), 236–240.
Head, K., Mayer, T., & Ries, J. (2009). How remote is the offshoring threat? European Economic Review, 53(4), 429–444.
Hill, T. P. (1977). On goods and services. The Review of Income and Wealth, 23, 315–338.
Hindley, B., & Smith, A. (1984). Comparative advantage and trade in services. The World Economy, 7, 369–390.
Kathuria, S., & Malouch, M. M. (2016). Strengthening competitiveness in Bangladesh—Thematic assessment: A diagnostic trade integration study. World Bank Group.
Kimura, F., & Lee, H.-H. (2006). The gravity equation in international trade in services. Weltwirtschaftliches Archiv, 142(1), 92–121.
Markusen, J. (1989). Trade in producer services and in other specialized intermediate inputs. American Economic Review, 79, 85–95.
Maurer, A., Marcus, Y., Magdeleine, J., & d’Andrea, B. (2008). Measuring trade in services. In A. Mattoo, R. M. Stern, & G. Zanini (Eds.), A handbook of international trade in services (p. 133). Oxford University Press.
Mirza, D., & Nicoletti, G. (2004). What is so special about trade in services? [Research paper 2004/02]. Leverhulme Centre for Research on Globalisation and Economic Policy.
Nath, H. K., & Goswami, B. (2018). India’s comparative advantages in services trade. Eurasian Economic Review. https://doi.org/10.1007/S40822-018-0098-0
Paul, A., & Nayak, S. K. (2024). Dynamics of FDI inflows in India: An application of ARDL and FMOLS. Journal of International Business and Economy, 24(2). https://doi.org/10.51240/jibe.2023.2.2
Paul, A., & Nayak, S. K. (2025a). Dynamic Panel Data analysis of intra-industry trade in services in South Asia. Global Journal of Emerging Market Economies, 0(0). https://doi.org/10.1177/09749101251353480
Paul, A., & Nayak, S. K. (2025b). Analysing intra-industry trade and revealed comparative advantage in services: A study of India’s services sector. The Indian Economic Journal, 0(0). https://doi.org/10.1177/00194662251371261
Sadiq, R., Sheraz, S., Ali, M. M., & Nazeer, S. (2023). Exploring the contribution of the service sector to economic growth and job creation: Empirical evidence from South Asia. Review of Applied Management and Social Sciences. https://doi.org/10.47067/ramss.v6i2.314
Singh, H., & Kumar, S. (2014). Growth of services sector in India. Asian Journal of Multidisciplinary Studies, 2, 12–17.
Spearman, C. (1904). The proof and measurement of association between two things. The American Journal of Psychology, 15(1), 72. https://doi.org/10.2307/1412159
