IIFT International Business and Management
Review Journal
Review Journal

 Search
1Department of Marketing and International Business, K J Somaiya Institute of Management, Somaiya Vidyavihar University, Mumbai, Maharashtra, India
2Faculty of Finance, National Institute of Industrial Engineering, Mumbai, Maharashtra, India
3K J Somaiya Institute of Management, Somaiya Vidyavihar University, Mumbai, Maharashtra, India

Creative Commons Non Commercial CC BY-NC: This article is distributed under the terms of the Creative Commons Attribution-NonCommercial 4.0 License (http://www.creativecommons.org/licenses/by-nc/4.0/) which permits non-Commercial use, reproduction and distribution of the work without further permission provided the original work is attributed.
The purpose of this article is to investigate the antecedents of satisfaction of consumers with chatbots using service quality (SERVQUAL) in the South Asian context. Customer satisfaction is one of the critical attitudinal variables that may influence customer behaviour and lead to greater customer loyalty. Automated query resolutions facilitated through AI chatbots are used to enhance SERVQUAL and customer satisfaction. However, it has been observed that inability to resolve queries satisfactorily results in frustration and abandonment of the channel. To address this service deficiency, the proposed study uses the SERVQUAL scale to identify antecedents of customer satisfaction. A total of 355 usable responses were collected from consumers who used chatbot services across different sectors. Confirmatory factor analysis and structural equation modelling (AMOS 26) were employed to test the proposed model. Tangibles, assurance and efficiency were significant in explaining customer satisfaction while responsiveness and privacy were insignificant. Assurance was significant and caused dissatisfaction when perceived as absent; tangibles were significant but were no longer a differentiator; efficiency was perceived as significant and can be critical in building assurance and accelerating adoption. The findings from this study provide beneficial insights to businesses who handle large volumes of service requests for instance, digital banking applications, travel sites, e-commerce sites and educational institutions. Businesses need to focus on critical service dimensions like assurance and efficiency rather than improving the conversational ability of chatbots. This article addresses an important paradox namely poor satisfaction with chatbot services despite demand for technology-enabled services. Theoretically speaking, easy-to-use and easy-to-access technologies should result in higher engagement among consumers. However, the rapid deployment of chatbots by businesses is met with high dropout in chatbot service channel. Technology adoption has been studied widely, but this study addresses the larger issue of what could enable better customer satisfaction in an easy-to-use technology.
AI chatbots, customer satisfaction, service quality, service delivery
Introduction
Chatbots are computer programs that maintain a conversation with a user in natural language, understand the users’ intent and send responses based on the organisation’s business rules and data (Deloitte, 2017). Customers’ demand for instant service resolution and increasing pressure on contact centres due to high turnover rates fuel the market forces driving chatbot implementation (Deloitte, 2018). The chatbot ecosystem is rapidly evolving through variegated offerings, including personalised restaurant recommendations, loan applications, ride-hailing, apparel recommendations and order status checks. Chatbot assistance is highly effective in routine transactions, recommendations, or complaint resolution. However, in a highly populous nation like India, transactions are still carried out in the hybrid model. A man–machine interface is standard across highway toll booths, airport check-in kiosks and kiosks at quick-service restaurants owing to the availability of a low-cost workforce.
A recent survey of consumers from around the world indicated that 86% of customers preferred interacting with a human agent to a chatbot. In contrast, only 30% stated that chatbots were more effective than human agents for query resolution (Press, 2019). While evidence from practice shows that firms in India that have deployed chatbots report better efficiency, cost savings and quicker resolution of queries for the customer, there is no explicit focus on replicating human-like experiences through chatbots. Complex service requests are resolved using a human interface, while repetitive queries are left to chatbots (Sheth, 2019).
The availability of a good quality workforce seems to provide a differentiated context to view customer satisfaction with chatbots, that is, quick and efficient service. A key differentiating factor between the technologically mature western nations vis-a-vis South Asia is the abundance of human resources and consequent human interactions. The context of western research is rooted in the customer’s emotional state while interacting with humanised chatbots. Studies centred around anthropomorphism (attribution of human traits) focus on the customer’s emotional state while engaging with a chatbot. The absence of extensive human interactions in the more developed and less populated western nations makes human-like traits very desirable in chatbots. Anger (Crolic et al., 2022), trust (Mozafari et al., 2020), engaging in personal conversation, listening and displaying warmth (Soderlund, 2022) have been studied in measuring customer satisfaction. However, it is essential to understand the antecedents of customer satisfaction in a nuanced manner that centre stages the South Asian context.
The present study uses a sample size of 355 participants to identify critical service dimensions that drive customer satisfaction. It combines the Service Quality Framework (SERVQUAL) (Parasuraman et al., 1985, 1988) and E-Service Quality Framework (E-S-QUAL) (Parasuraman et al., 2005) to identify the critical service dimensions that drive customer satisfaction. Our study reveals that assurance followed by efficiency and tangibles are essential drivers of customer satisfaction with a chatbot. Customers were dissatisfied with the current levels of assurance and efficiency, indicating that inconsistent query resolution has led to a lack of trust in chatbots, thus increasing the preference for human service agents. Focusing on a consistent resolution of basic requests and queries is vital in increasing customer satisfaction compared to features such as personalisation and conversational abilities, which do not impact satisfaction.
The rest of the article is organised as follows: the literature review is followed by hypotheses, a discussion on research methods, analysis and results, discussion of results, and theoretical and managerial implications.
Literature Review and Hypotheses
E-commerce and self-service technologies, such as self-checkout counters and kiosks, face more extended adoption periods since a learning curve is associated with adapting to such technology (Meuter et al., 2005). On the other hand, interacting through chat is an intrinsic part of a customer’s daily life. They spend 2 hours on average per day communicating on messaging applications such as Facebook and WhatsApp (Statista, 2018). Low usage of chatbots has less to do with chatbot ability and customer readiness and more to do with the frequent failure of chatbots to meet customers’ expectations (Adam et al., 2020). ‘Service encounters are critical moments of truth in which customers often develop indelible impressions of a firm’ (Bitner et al., 2000, p. 139). SERVQUAL can be a crucial construct to explain customer satisfaction since it positively influences customers’ behavioural intention, satisfaction and loyalty. Customer satisfaction is one of the critical attitudinal variables that may influence customer behaviour and greater customer loyalty (Lee et al., 2009).
Anthropomorphism
Anthropomorphism, or the attribution of human-like properties, characteristics, or mental states to nonhuman agents and objects (Epley et al., 2007; Waytz et al., 2010), has dominated the discourse on chatbots in the recent literature (Crolic et al., 2022; Soderlund, 2022; Troshani et al., 2021). Some of the more apparent benefits of humanised chatbots are enjoyable customer experiences and resultant purchase intentions (Han, 2021; Holzwarth et al., 2006; Yen & Chiang, 2021), friendship with users leading to increased loyalty (Schweitzer et al., 2019), increased trust by increasing perceived competence (Waytz et al., 2014). Han and Yang (2018) have opined that the anthropomorphic characteristics add a degree of charm and affection to customer interactions, thereby leading to continued application usage. The deployment of anthropomorphic features in chatbots in critical services results in higher positive usage intentions (Blut et al., 2021). While humanised chatbots are found to result in cost reduction and control over the quality of interactions with the customer, Crolic et al. (2022) have warned against ‘unconditional deployment’, which could lead to adverse outcomes. Recent research has found that human users experience distrust and even revulsion while interacting with robots with more remarkable human resemblance (Mathur & Reichling, 2016). Yang et al. (2022) find that in situations where customers perceive low process and outcome control, AI service agents with a less anthropomorphic design might be more attractive. While anthropomorphic chatbots influence trust and can lead to a better customer experience, customers expect chatbots to perform services reliably (Troshani et al., 2021). Anthropomorphic design in branding and product design contexts may not always produce beneficial outcomes (e.g., Kim et al., 2016; Kwak et al., 2015). The degree of anthropomorphism in AI applications can be better determined by the functions they intend to perform (Troshani et al., 2021). Applications meant to support sociorelational services (healthcare, for example, where empathy is the key) may need to be designed to exhibit greater anthropomorphism levels than AI applications meant to support repetitive tasks or improve efficiency (a food delivery application, for example).
Service Quality and Customer Satisfaction
We integrate two main theories popular in the service literature—the SERVQUAL model (Parasuraman et al., 1988) and E-S-QUAL (Parasuraman et al., 2005) to identify service dimensions better to evaluate customer satisfaction. The SERVQUAL model has been widely used across different service settings and cultural contexts (Meyer-Waarden et al., 2020). Both academicians and practitioners regard the SERVQUAL model to measure the level of customer service satisfaction (Seth et al., 2006). From a customer perspective, SERVQUAL is a subjective evaluation of the service in the interactive service delivery process (Dabholkar et al., 2000; Parasuraman et al., 1988). From an organisation’s perspective, consistency with the initial design defines SERVQUAL (Golder et al., 2012). SERVQUAL can be broadly defined as a customer’s comparison of different service expectations vis-à-vis its performance. When technology adds value to the service experience, companies can increase customer satisfaction and competitive advantage (Bitner et al., 2010). Customer satisfaction and SERVQUAL are interrelated, and in a competitive business scenario, SERVQUAL is an essential factor that impacts customer satisfaction (Adhikari & Paul, 2016; Agbor, 2011). SERVQUAL has been measured extensively in the brick and mortar businesses (Cui et al., 2003; Lai et al., 2018; Wong & Fong, 2012). However, we notice a lack of SERVQUAL studies on online businesses in emerging economies.
Cai and Jun (2003) identified shortcomings of the existing models in measuring SERVQUAL. They suggested the four-element dimension of E-S-QUAL, including website design/content, trustworthiness, prompt/reliable service and communication, with an integrated perspective of both online buyers and information searchers. While E-S-QUAL has four dimensions (efficiency, system availability, fulfilment and privacy), SERVQUAL has five dimensions of SERVQUAL (tangibles, assurance, reliability, responsiveness and empathy). Assurance has the highest impact on customer satisfaction (Ghost & Gnanadhas, 2011; Jain & Gaur, 2012). Empathy (human-like) enhances firm-customer interactions (Murtarelli et al., 2021); marks the high quality of service (Parasuraman et al., 1988); creates positive perception (Li & Sung, 2021); reduces customers’ perceived risk; and enhances customers’ trust and credibility in AI chatbot (Murtarelli et al., 2021). However, given the high degree of involvement of human resources and the prevalence of hybrid mode in service delivery, empathy does not resonate in the South Asian context and is not included in our framework. System availability and fulfilment (order delivery and availability of items) were not considered since chatbots are available 24 × 7, and delivery is not a functionality of chatbots. Poon and Lee (2012) suggested that efficiency and reliability overlapped, making efficiency a good measure of service dimension. The purpose of the present study is to develop a parsimonious model of SERVQUAL for chatbots by examining the service dimensions that consumers use to evaluate both SERVQUAL and E-S-QUAL.
The conceptual framework developed by the authors uses three dimensions from SERVQUAL: tangibles, assurance and responsiveness, and two from E-S-QUAL, namely efficiency and privacy.
Assurance
The assurance dimension indicates how competent, knowledgeable and courteous employees are during the service interaction. Further, the ability to build trust in customers is an integral part of assurance (Parasuraman et al., 1985, 1988). In sectors like banking, knowledge of personnel is extremely critical in building trust (Kant & Jaiswal, 2017), while in the case of online shopping, lack of trust is cited as a reason for not shopping online (Rasty et al., 2020). The importance of assurance varies across research. However, Gronroos (1988) opined that assurance was the most critical service dimension. In the context of chatbots, assurance implies the ability to proficiently address customers’ queries with accurate answers, in the least response time and in a consistent manner, thereby building trust over time. Hence, we propose Hypothesis 1 as follows.
H1: Assurance (competence, knowledge) positively affects customer satisfaction with chatbots.
Tangibles
Parasuraman et al. (1985, 1988) specify tangibles as physical facilities that include equipment, personnel and materials used for communication. Customers attribute good tangibles as an indication of care and concern shown by the service provider (Fitzsimmons et al., 2008). Huang et al. (2007) E-S-QUAL framework suggest design as one of the online tangible cues that indicate visual appeal. Further, Mollen and Wilson (2010) state that in a virtual environment, the design enhances telepresence, which is defined as the psychological state of ‘being there’. The use of texts, graphics and colour, ease of navigation, uncluttered interface, logical flow of the conversation and easy search path, among others, form an integral part of the tangible facets of E-S-QUAL. Hence, the second hypothesis is derived as follows.
H2: Tangibles (colours, visual appearance) positively affect customer satisfaction with chatbots.
Responsiveness
Responsiveness as a dimension of SERVQUAL refers to the organisation’s willingness and ability to help customers and provide quick service within the stipulated time frame (Parasuraman et al., 1985, 1988). The willingness of employees to provide service irrespective of time has an impact on customer satisfaction (Parasuraman et al., 1988). The ability of the firm to respond to customers and provide individualised attention increases customer satisfaction. Notably, in sectors like banking, responsiveness directly impacts customer satisfaction (Kant & Jaiswal, 2017). In case of a breakdown in service, the ability of the organisation to recover quickly and respond to customer queries and requests has a direct impact on SERVQUAL (Hernon & Nitecki, 2001). Yarimoglu (2014) elaborated responsiveness to encompass mailing the transaction slip, calling back the customer quickly and providing prompt service. In chatbots, responsiveness implies understanding customer queries and informing customers when the required services will be performed. Hence the third hypothesis is as follows:
H3: Responsiveness (understanding and prompt) positively affects customer satisfaction with chatbots.
Efficiency
Efficiency and reliability of SERVQUAL in technology scenarios are closely linked (Poon & Lee, 2012). An important criterion of customers opting for technology-enabled services is the time taken for resolution (Collier & Kimes, 2013). In other words, when customers perceive that service resolution is faster due to technology than human agents, they would use technology-enabled services. Constraints due to location and time can decide which service channel a customer should opt for (Collier & Sherrell, 2010). Further, when service delivery time is considerably reduced, customers prefer to use technology-enabled services over human interaction (Lee & Yang, 2013). Studies on self-service technologies highlight that fast service resolutions are one of the most important factors that drive customer satisfaction (e.g., Collier & Kimes, 2013; Howard & Worboys, 2003; Meuter et al., 2000). When customers perceive that their service requests would be resolved quickly, they are more likely to rate that service channel higher, leading to higher customer satisfaction (Collier & Sherrell, 2010). In chatbots, efficiency relates to the response time and accuracy with which customers’ queries are resolved. We hypothesise that efficiency is an essential antecedent of customer satisfaction.
H4: Efficiency (speed of query resolution) positively affects customer satisfaction with chatbots.
Privacy
The rise of disruptive technologies and issues regarding regulation on the internet have created challenges for firms to assure consumers regarding data sharing and privacy (Bandara et al., 2020). Privacy implies that customer data is secure and disseminated to other businesses only after obtaining customer consent. Security and confidentiality shape the usage of technology services (Lu et al., 2018). Customers are concerned with data sharing and usage through mobile applications and websites (Feng & Xie, 2019; Wottrich et al., 2018). Consumers of line banking services identified security as a critical determinant of E-S-QUAL (White & Nteli, 2004) and the most crucial factor in visiting a site and making purchases (Ranganathan & Ganapathy, 2002; Yoo & Donthu, 2001). Privacy encompasses the protection of any data shared by the customer with the chatbot during their interaction. As consumers conduct online financial transactions, the role of ethical behaviour by financial service providers is significant (Patterson & McEachern, 2018). Hence, the fifth hypothesis is as follows:
H5: Privacy (secure and confidential interaction) positively affects customer satisfaction with chatbots.
The conceptual framework used for this study is depicted in Figure 1.
Research Methodology
We used a mixed-method consisting of qualitative and quantitative analysis. The qualitative research aims to help identify critical and redundant constructs from the existing framework. A discussion guide was used to conduct in-depth interviews among 15 participants. We recruited participants from diverse backgrounds to extract varied perspectives (4 academicians who had published research in the relevant areas; 8 industry practitioners with over 10 years of experience across financial services, consulting, information technology and supply chain; 3 senior industry professionals with more than 25 years of experience in the banking and manufacturing industries). The participants were active users of chatbot services and part of the design and solution team for various functions in business. Inputs drawn from the qualitative research were used to design the questionnaire, divided into the following three sections—demographic details, perception of different service dimensions and overall satisfaction with chatbots.
Figure 1. Framework for Customer Satisfaction with Chatbots.

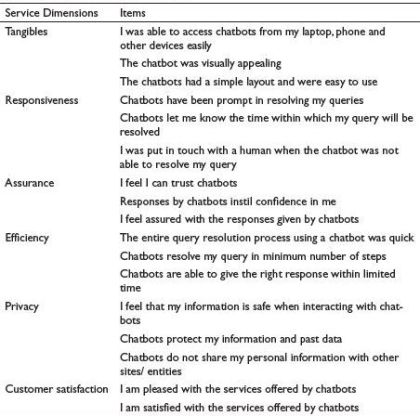
The final questionnaire measured 17 items, incorporating the SERVQUAL (Parasuraman et al., 1985, 1988) and E-S-QUAL measures (Parasuraman et al., 2005). Three items measured the following five service dimensions: tangibles, responsiveness, assurance, efficiency and privacy. ‘Customer satisfaction’ was the dependent variable consisting of the following two statements—‘I am pleased with the services offered by chatbots’ and ‘I am satisfied with the services offered by Chatbots’. A five-point Likert scale with 1 = Very Dissatisfied and 5 = Very Satisfied was used. Pilot surveys follow a subjective decision of the survey administrator regarding the sample size since there are no specific rules and formulas that indicate the adequate pretest sample size (Naumann & Giel, 1995). A group of 20 respondents was selected as part of the pilot survey to identify and eliminate potential problems and modify the questionnaire based on the feedback given by these respondents. The participants were equally divided between males and females (10, 10), used chatbots frequently, and were skewed towards the younger age group (9 respondents in the age group of 18–24, 7 in 25–34 and 4 in 35–44).
All aspects of the questionnaire were tested, including question content, wording, sequence, form and layout, question difficulty and instructions. Respondents in the pretest shared similar characteristics with those in the actual survey regarding their background, familiarity with the topic and interest levels (Reynolds & Diamantopoulos, 1998).
A team of 10 interviewers collected the data. The interviewer teams were briefed about the study’s objective and asked to conduct mock interviews to check their ability to probe for responses. Participants were chosen based on the frequency of usage, and the sample included demographic subsets such as age, gender, education and income. A link to the questionnaire was emailed to the participant’s post confirmation of their availability for the study. The interviewers then contacted them at a pre-decided time to fill in the questionnaire. The authors ensured no abnormal skew towards a particular gender, age group, city and chatbot usage by different sectors. The authors checked the key demographic criteria and chatbot usage across sectors after every 100 interviews. This resulted in five checks, and any skew that was observed was duly corrected in the next phase. The data was collected over 3 months, from October to December 2020. A total of 500 respondents were contacted, of which 415 respondents agreed to participate in the survey. In total, 60 questionnaires with inconsistent, incomplete, spurious or erroneous responses were eliminated post back checks, and the final usable sample for the study was 355. The final achieved response rate for the survey was 71%. A response rate of 55.6% is an acceptable norm for behavioural studies (Baruch, 1999).
Results
Table 1 summarises the findings from the qualitative research. Table 2 indicates service dimensions retained and dropped post the qualitative analysis.
The results from the qualitative study imply that the respondents value efficiency and quick resolution over enhanced anthropomorphic features such as empathy or enriching conversations.
Sample characteristics were studied using univariate data analysis IBM SPSS 26. The sample demographic details are given in Table 3. The data showed higher percentage of males (58%), younger population (61% belonged to 18–34 years). The monthly household income was evenly distributed and there was slightly higher percentage of participants who used chatbots on food aggregator sites (62% preferred Food Aggregator sites such as Zomato and Swiggy).
The 17 items that measured tangibles (3 items), assurance (3 items), responsiveness (3 items), efficiency (3 items), privacy (3 items) and customer satisfaction (2 items) were tested using Confirmatory Factor Analysis (details in Table 4).
Table 1. Findings from Qualitative Research.

Table 2. Service Dimensions Retained and Dropped.

Common Method Bias Test
Common method bias (CMB) was carried out to ensure that data was ‘free from bias’. This study adopted a multilevel approach. We used reversed coded items to prevent respondents from losing their attention while answering the questionnaire and used ‘Harman’s single factor test’ to ensure that the data was free from bias. The result indicates that the highest total variance value explained for a single factor is 37.24%, which is less than the recommended (50%) (Podsakoff et al., 2012). Therefore, the data did not find any issue related to CMB. Further, we used the marker-variable technique in confirmatory factor analysis to ensure that the data was free from CMB. The findings demonstrate that the collected data does not have a CMB problem.
Table 3. Demographic Profile.
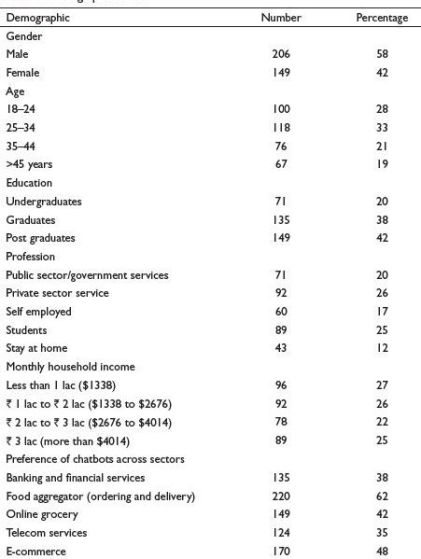
Table 4. Service Dimensions and Items.
CFA was used to evaluate the following six latent dimensions: tangibles, assurance, responsiveness, efficiency, privacy and customer satisfaction. Each of these latent constructs was measured by their respective observed variables. The overall fit of the model was improved by dropping one item from responsiveness. The item was dropped after studying the factor loading, which was below 0.4 (Hair et al., 2012). After the item was deleted, the new measurement model had 16 items. The final CFA model was found to be acceptable. Details of the various indices are as follows: χ2 /df = 1.59 χ2/df  2.0 considered acceptable; CFI = 0.955, CFI > 0.95 considered good; GFI = 0.901; GFI > 0.90 considered good; TLI = 0.94 TLI > 0.90 good, NFI = 0.891; NFI > 0.90 considered good; RMSEA = 0.062; and RMSEA
  0.08 considered good. The measurement model was assessed for convergent validity by examining the factor loading, average variance extracted (AVE) and composite reliability (C.R.). Internal reliability was measured using Cronbach’s alpha. Table 5 provides details of the reliability and validity measures. Discriminant validity was tested using AVE analysis (Table 6). The value of AVE for each construct should be at least 0.50 and much larger than the correlation of a specific construct with other constructs (Fornell & Larcker, 1981). In case AVE is less than 0.5 but C.R. is higher than 0.6, the convergent validity of the construct is still adequate (Fornell & Larcker, 1981). Hence, while the AVE for Tangibles was 0.41, the C.R. was 0.67, indicating that the convergent validity of the construct is adequate.
Table 5. Reliability and Validity Measures.

Source: Hair et al. (2012).
Note: Composite reliability > 0.7, AVE > 0.5 and internal reliability > 0.6 .
Table 6. Average Variance Extracted Analysis.
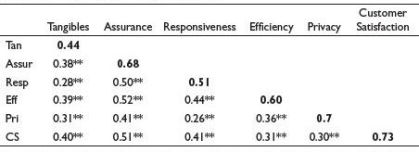
Note: The numbers in bold in the diagonal is the square root of the average variance extracted of each construct.
**Significant at 5% level of significance.
The final CFA model was then modelled using Structural Equation Modelling. Figure 2 shows the final model with the exogenous constructs tangibles, assurance, responsiveness, efficiency and privacy, while the endogenous construct was customer satisfaction.
Structural Equation Modelling was used to test the hypotheses. The results are given in Table 7 and Table 8. Regarding H1, the results show that assurance (competence, knowledge) positively affects customer satisfaction with chatbots. (Std β = 0.44, p < .001). Tangibles (colours, visual appearance) have a positive effect on customer satisfaction with chatbots (Std β = 0.23, p < .05). Thus, H2 is accepted. Efficiency (speed of query resolution) has a significant positive effect on customer satisfaction (Std β = 0.37, p < .001). Thus, H4 is accepted. Responsiveness (understanding and prompt) does not significantly affect customer satisfaction with chatbots (Std β = 0.11, p value = .748). Thus, H3 is rejected. Privacy (secure and confidential interaction) does not significantly affect customer satisfaction with chatbots (Std β = 0.07, p value = .355). Thus, H5 is rejected.
Figure 2. Structural Equation Modelling.

H1, H2 and H4 were supported, while H3 and H5 were not supported (see Figure 2, Table 7 and Table 8).
Thus, the research revealed that assurance, efficiency and tangibles were the factors that significantly impacted customer satisfaction with chatbots. Responsiveness and privacy, which were hypothesised as significant drivers of customer satisfaction, were insignificant predictors. We explain each service dimension in the following section.
Performance of Key Service Dimensions
To understand the performance of the service dimensions (tangibles, assurance and efficiency) with respect to overall customer satisfaction, the mean scores of the responses were evaluated (see Table 9). The mean scores indicated that customer perception about SERVQUAL dimensions in chatbot services were favourable for Tangibles. Participants rated Chatbots on tangibles as a service dimension favourably with a mean score of 3.80 (80% of the customers found chatbots had a simple layout and were easy to use). Efficiency was rated moderately with a mean score of 3.37, while assurance was rated negative and found significant (mean score of 2.95). Of the insignificant factors, responsiveness was rated moderately (mean score = 3.43), while privacy was rated average (mean score = 3.01) (satisfaction measure on 5-point scale, 5 = Very Satisfied). Tangibles performed above average, responsiveness and efficiency had an average performance, while the least performing dimensions were assurance and privacy (see Table 7). Customer satisfaction with chatbot services received an average score of 3.37, indicating that customers did not have a favourable opinion of chatbots.
Table 7. Regression Weights.

Note: ***Significant at 1% level of significance.
Table 8. Standardised Regression Weights.

Assurance, Efficiency and Tangibles were found to be ‘must-have’ features in customer-chatbot interactions to increase satisfaction levels. Responsiveness and privacy were favourable features but did not impact customer satisfaction. Most chatbots have a well-defined user interface, and hence tangibles as a service dimension are no longer a differentiator. On the other hand, customers expect the correct responses to their queries in fewer steps and less response time. This is where chatbots across sectors differed on customer satisfaction.
Discussion
The results on assurance, efficiency and tangibles are on expected lines. However, the results on responsiveness and privacy are somewhat counter-intuitive. The ease of availability of people-powered services in India may help in explaining why responsiveness is given low priority. Data privacy in the legislative context is still in the nascent stages in India. Personal data protection has still not been legislated, nor do the Indian users report high levels of awareness as far as data protection is concerned. The lack of legal framework and lack of awareness at the individual level could explain the results of this study which finds privacy and security insignificant factors.
Table 9. Performance of Chatbots.

Building robust interactive response systems through extensive machine learning is a critical part of assurance. Our results align with the literature, which states that assurance positively impacts customer satisfaction with chatbots (Li et al., 2021; Trivedi, 2019). Confirming the literature by Wang et al. (2006) finds that when service agents are perceived as credible, impartial experts, users trust chatbots, leading to greater assurance. Similarly, accuracy, credibility and competence enhance customer satisfaction in luxury brands (Chung et al., 2018). However, the low mean score indicates that chatbots were lacking in delivering the correct responses to queries and requests (refer to Table 9). Our study finds that the absence of assurance caused customer dissatisfaction.
Efficiency was the second most crucial antecedent that significantly affected customer satisfaction. In the context of chatbots, consumers expect chatbots to respond with the correct response in a minimum number of steps (Meyer-Waarden et al., 2020). However, mean scores indicate that respondents were not fully satisfied with the efficiency of chatbots (refer to Table 9). Our discussion with respondents revealed that chatbots were efficient on food delivery sites for queries related to the status of an order and the time taken for delivery. In contrast, banking sites reported a good performance on queries regarding account statements and address updates. (summary of discussions reported in Table 1). However, chatbots took respondents on an endless loop on travel sites for basic queries like flight schedules resulting in frustration and preference for human agents. The loss of time by switching from one service channel to another resulted in dissatisfaction and lower usage of chatbots over time.
Tangibles significantly impacted customer satisfaction, and customers were quite satisfied with this dimension (details in Table 9). Our study supports existing research, whereby a tangible, physical environment generates favourable customer evaluation (Wakefield & Blodgett, 1999). However, with the rapid proliferation of chatbots, the appeal of tangibles and aesthetics on product usability is strong only in the short term, either before or during the early stage of adoption of a product, and it quickly vanishes once users have become acquainted with a product (Minge & Thüring, 2018)
Users expect chatbots to respond with accurate and timely information for queries, complaints and requests. Tangibles have performed well, possibly because of the rapid digitalisation and better understanding of customer requirements, enabling service providers to give better user interface and customer experience. Service providers need to design responsive, interactive and efficient systems while maintaining visual appeal. The lack of awareness of security issues creates the need for the service provider to provide security features on the chatbots proactively. Chopra and Ranjani (2020) recommend using cyber security tips and pointers to be built into the application itself. Customer protection cannot be left to regulatory compliance but must be integrated into the product itself.
Implications
The study has theoretical contributions and practical implications for academia, businesses and chatbot vendors.
Theoretical Implications
On a theoretical level, our study offers two main contributions. First, we have integrated two well-established theories, SERVQUAL and E-S-QUAL that would allow businesses to identify critical service dimensions that impact customer satisfaction. Most studies that focus on SERVQUAL in the online environment context such as the CiteQUAL (Yoo & Donthu, 2001), the WEBQUAL 1.0 to WEBQUAL 4.0 (Barnes & Vidgen, 2001, 2002), the eTailQ (Wolfinbarger & Gilly, 2003), the 11 dimensions of the SERVQUAL of online shopping proposed by Zeithaml et al. (2005), the four dimensions proposed by Cox and Dale (2001) and the dimension summarisation in review work (Madu & Madu, 2002) capture the views of online buyers while ignoring other perspectives such as information searchers. Our framework has an integrated perspective of measuring the impact of SERVQUAL on customer satisfaction with chatbots of both online buyers and information seekers.
Next, our study focuses on customer satisfaction with chatbot in the South Asian context. Home to 25% of the total world population (United Nations, 2021), South Asia has access to good quality and skilled workforce at a low cost. Several services are rendered exclusively by humans, and it is common to see AI services deployed along with humans rather than as stand-alone services. Therefore, our study underlines the need for a differentiated chatbot.
Practical Implications
Chatbot developers focus on bettering the conversational abilities of the bots to make them sound more natural, human-like and empathetic. Customers who interact with chatbots do not expect human-like conversations or empathy from them (Lei et al., 2021). Soderlund (2021) explains this phenomenon as ‘deception’. Yu and Sangiorgi (2018) suggest that a holistic understanding of user experiences in designing chatbots would result in wide adoption, while Dietvorst et al. (2015) propose that trust will lead to broader adoption. Our results help explain the role of assurance, efficiency and tangibles in the broader adoption of chatbots. Focusing on efficiency will build assurance critical for the wider adoption of chatbots. Assurance, which represents the trust and confidence of customers, can only be built over consistent and seamless interaction.
The respondents of this study have placed a high value on the efficiency dimension, which implies that users have made extensive use of chatbots for non-critical service contexts. We see the potential for AI chatbots to be deployed in educational institutions, government services and other organisations (where service requests are routine and repetitive) to automate the query resolution process and reduce the load on their respective contact centres. Digital banking led by mobile payment services is gaining traction in the Indian banking ecosystem (Kar, 2020). In the banking sector, for example, successful resolution of basic requests will instantly lead to customer satisfaction, which, in turn, will create a willingness to use chatbots for future service requests. As a growing base of millennials enters the workforce, many seek information to plan their future better (Barbi et al., 2019). Integrating AI chatbots with wealth advisory services would help drive cross-selling of various financial instruments among young consumers through the digital medium. Healthcare systems have undergone a transformational change aided by AI chatbots for digital health (Wamba & Queiroz, 2021). As interactions with chatbots become more frequent, data generated through these interactions will enable highly personalised conversations in the future. Recommendation functions using sophisticated AI technology can be incorporated into chatbots once customers develop a high level of trust towards the brand and show an inclination towards adopting the personalised services offered by these chatbots.
Organisations adopting AI chatbots face the dilemma of finding an optimal balance between the familiar human touch and technology’s desired speed and efficiency (Solnet et al., 2019). Due consideration should be taken regarding the nature of the service task, service offering and service process before using AI to engage with customers (Huang & Rust, 2021).
Limitations and Directions for Future Research
First, the study was restricted to urban customers. Second, the study has only examined the perception of the users of chatbots. Third, the study was conducted in India and maybe more reflective of the South Asian subcontinent. The implications, therefore, may be more applicable to emerging economies. Fourth, the study has not been done sector-wise but at an aggregated level. Fifth, the study has not identified chatbot used for critical and non-critical sectors. Sixth, our study used a cross-sectional survey, which cannot be relied upon to provide causal evidence.
Studies comparing the differences between rural and urban consumers would provide valuable insights to chatbot vendors. Second, follow-up studies from the perspective of key stakeholders in different business sectors will facilitate chatbot developers and vendors to bridge the gap between business outcomes and customers’ expectations. Certain innovative features, like voice ordering, are now being incorporated into chatbots in developed countries. Understanding the impact of such functionalities across the value chain can create a road map for critical stakeholders keen on regularising the use of interactive chatbot technologies. Third, given that developed countries are reporting the deployment of sophisticated chatbots, it may be worthwhile to conduct a comparative cross-national study to understand the low usage of chatbots better. Fourth, sector-specific studies on understanding customer satisfaction with chatbots would provide more nuanced implications for businesses. Next, examining the differences in expectations regarding chatbot services between critical and non-critical sectors would offer significant insights. Last, experimental methods (Crolic et al., 2022; Mozafari et al., 2020) may provide causal evidence for the impact of various dimensions on customer satisfaction with chatbots.
Declaration of Conflicting Interests
The authors declared no potential conflicts of interest with respect to the research, authorship and/or publication of this article.
Funding
The authors received no financial support for the research, authorship and/or publication of this article.
Adam, M., Wessel, M., & Benlian, A. (2020). AI-based chatbots in customer service and their effects on user compliance. Electronic Markets, 31(2), 427–455. https://doi.org/10.1007/s12525-020-00414-7
Adhikari, K., & Paul, B. (2016). Impact of perceived service quality on customer satisfaction in United Bank of India: A perceptual study. International Journal of Innovative Research in Management Studies (IJIRMS), 1(2), 13–22.
Agbor, J. M. (2011). The relationship between customer satisfaction and service quality: A study of three service sectors in Umeå. Umeå University, Faculty of Social Sciences, Umeå, Sweden. https://www.diva-portal.org/smash/record.jsf?dswid=5116&pid=diva2%3A448657
Bandara, R., Fernando, M., & Akter, S. (2020). Addressing privacy predicaments in the digital marketplace: A power-relations perspective. International Journal of Consumer Studies, 44(5), 423–434. https://onlinelibrary.wiley.com/doi/abs/10.1111/ijcs.12576
Barbi?, D., Lu?i?, A., & Chen, J. M. (2019). Measuring responsible financial consumption behaviour. International Journal of Consumer Studies, 43(1), 102–112.
Barnes, S. J., & Vidgen, R. T. (2001). An evaluation of cyber-bookshops: The WebQual method. International Journal of Electronic Commerce, 6(1), 11–30.
Barnes, S. J., & Vidgen, R. T. (2002). An integrative approach to the assessment of e-commerce quality. Journal of Electronic Commerce Research, 3(3), 114–127.
Baruch, Y. (1999). Response rate in academic studies-A comparative analysis. Human Relations, 52(4), 421–438.
Bitner, M. J., Brown, S., & Meuter, M. L. (2000). Technology infusion in service encounters. Journal of the Academy of Marketing Science, 28(1), 138–149.
Bitner, M. J., Zeithaml, V. A., & Gremler, D. D. (2010). Technology’s impact on the gaps model of service quality. In P. P. Maglio, C. A. Kieliszewski, & J. C. Spohrer (Eds.), Handbook of service science (pp. 197–218). Springer.
Blut, M., Wang, C., Wünderlich, N. V., & Brock, C. (2021). Understanding anthropomorphism in service provision: A meta-analysis of physical robots, chatbots, and other AI. Journal of the Academy of Marketing Science, 49(4), 632–658.
Cai, S., & Jun, M. (2003). Internet users’ perceptions of online service quality: A comparison of online buyers and information searchers. Managing Service Quality: An International Journal, 13(6), 504–519.
Chopra, A., & Ranjani, K. S. (2020). Adoption of digital transaction model by micro enterprises to target millennials in India: An exploratory study. Social Business, 10(4), 411–434.
Chung, M., Ko, E., Joung, H., & Kim, S. J. (2018). Chatbot e-service and customer satisfaction regarding luxury brands. Journal of Business Research, 117, 587–595. https://doi.org/10.1016/j.jbusres.2018.10.004
Collier, J. E., & Kimes, S. E. (2013). Only if it is convenient: Understanding how convenience influences self-service technology evaluation. Journal of Service Research, 16(1), 39–51.
Collier, J. E., & Sherrell, D. L. (2010). Examining the influence of control and convenience in a self-service setting. Journal of the Academy of Marketing Science, 38(4), 490–509.
Cox, J., & Dale, B. G. (2001). Service quality and e-commerce: An exploratory analysis. Managing Service Quality: An International Journal, 11(2), 121–131.
Crolic, C., Thomaz, F., Hadi, R., & Stephen, A. T. (2022). Blame the bot: Anthropomorphism and anger in customer–chatbot interactions. Journal of Marketing, 86(1), 132–148.
Cui, C. C., Lewis, B. R., & Park, W. (2003). Service quality measurement in the banking sector in South Korea. International Journal of Bank Marketing, 21(4), 191–201.
Dabholkar, P. A., Shepherd, C. D., & Thorpe, D. I. (2000). A comprehensive framework for service quality: An investigation of critical conceptual and measurement issues through a longitudinal study. Journal of Retailing, 76(2), 139–173.
Deloitte. (2017, June). Conversational chatbots - Let’s Chat. Retrieved March 2020, from https://www2.deloitte.com/content/dam/Deloitte/in/Documents/strategy/in-strategy-innovation-conversational-chatbots-lets-chat-final-report-noexp.pdf
Deloitte. (2018, March). Chatbots point of view. https://www2.deloitte.com/content/dam/Deloitte/nl/Documents/deloitte-analytics/deloitte-nl-chatbots-moving-beyond-the-hype.pdf
Dietvorst, B. J., Simmons, J. P., & Massey, C. (2015). Algorithm aversion: People erroneously avoid algorithms after seeing them err. Journal of Experimental Psychology: General, 144(1), 114–126.
Epley, N., Waytz, A., & Cacioppo, J. T. (2007). On seeing human: A three-factor theory of anthropomorphism. Psychological Review, 114(4), 864–886.
Feng, Y., & Xie, Q. (2019). Privacy concerns, perceived intrusiveness, and privacy controls: An analysis of virtual try-on apps. Journal of Interactive Advertising, 19(1), 43–57. https://doi.org/10.1080/15252019.2018.1521317
Fitzsimmons, J. A., Fitzsimmons, M. J., & Bordoloi, S. (2008). Service management: Operations, strategy, and information technology (p. 4). McGraw-Hill.
Fornell, C., & Larcker, D. F. (1981). Structural equation models with unobservable variables and measurement error: Algebra and statistics. Journal of Marketing Research, 18(3), 382–388.
Ghost, F. H., & Gnanadhas, M. E. (2011). Impact of service quality in commercial banks on the customers satisfaction: An empirical study. International Journal of Multidisciplinary Research, 1(6), 19–37.
Golder, P. N., Mitra, D., & Moorman, C. (2012). What is quality? An integrative framework of processes and states. Journal of Marketing, 76(4), 1–23.
Gronroos, C. (1988). Service quality: The six criteria of good perceived service. Review of Business, 9(3), 10.
Hair, J. F., Sarstedt, M., Ringle, C. M., & Mena, J. A. (2012). An assessment of the use of partial least squares structural equation modeling in marketing research. Journal of the Academy of Marketing Science, 40(3), 414–433.
Han, M. C. (2021). The impact of anthropomorphism on consumers’ purchase decision in chatbot commerce. Journal of Internet Commerce, 20(1), 46–65.
Han, S., & Yang, H. (2018). Understanding adoption of intelligent personal assistants: A parasocial relationship perspective. Industrial Management & Data Systems, 118(3), 618–636.
Hernon, P., & Nitecki, D. A. (2001). Service quality: A concept not fully explored. Library Trends, 49(4), 687–708.
Holzwarth, M., Janiszewski, C., & Neumann, M. M. (2006). The influence of avatars on online consumer shopping behavior. Journal of Marketing, 70(4), 19–36.
Howard, M., & Worboys, C. (2003). Self-service–a contradiction in terms or customer-led choice? Journal of Consumer Behaviour: An International Research Review, 2(4), 382–392. https://doi.org/10.1002/cb.115
Huang, M.-H., Li, X., & Zeng, X. (2007, September). Service quality in Web 2.0 electronic commerce: An integrative perspective from typical service and technique-adoption [Paper presentation]. In 2007 International Conference on Wireless Communications, Networking and Mobile Computing (pp. 3258–3261). IEEE. http://doi.org/10.1109/WICOM.2007.807
Huang, M.-H., & Rust, R. T. (2021). Engaged to a robot? The role of AI in service. Journal of Service Research, 24(1), 30–41.
Jain, D., & Gaur, P. (2012). Perception of customers towards the quality of services provided by the banking sector: An empirical study. International Journal of Management Sciences, 1(3), 1–20.
Kant, R., & Jaiswal, D. (2017). The impact of perceived service quality dimensions on customer satisfaction. International Journal of Bank Marketing, 35(3), 411–430
Kar, A. K. (2020). What affects usage satisfaction in mobile payments? Modelling user generated content to develop the ‘digital service usage satisfaction model’. Information Systems Frontiers, 23(5), 1341–1361.
Kim, S., Chen, R. P., & Zhang, K. (2016). Anthropomorphized helpers undermine autonomy and enjoyment in computer games. Journal of Consumer Research, 43(2), 282–302.
Kwak, H., Puzakova, M., & Rocereto, J. F. (2015). Better not smile at the price: The differential role of brand anthropomorphization on perceived price fairness. Journal of Marketing, 79(4), 56–76.
Lai, I. K., Hitchcock, M., Yang, T., & Lu, T. W. (2018). Literature review on service quality in hospitality and tourism (1984-2014): Future directions and trends. International Journal of Contemporary Hospitality Management, 30(1), 114–159.
Lee, H.-J., & Yang, K. (2013). Interpersonal service quality, self-service technology (SST) service quality, and retail patronage. Journal of Retailing and Consumer Services, 20(1), 51–57. https://doi.org/10.1016/j.jretconser.2012.10.005
Lee, K., Joshi, K., & Bae, M. (2009). A cross-national comparison of the determinants of customer satisfaction with online stores. Journal of Global Information Technology Management, 12(4), 25–51.
Lei, S. I., Shen, H., & Ye, S. (2021). A comparison between chatbot and human service: Customer perception and reuse intention. International Journal of Contemporary Hospitality Management, 33(11), 3977–3995. https://doi.org/10.1108/IJCHM-12-2020-1399
Li, L., Lee, K. Y., Emokpae, E., & Yang, S. B. (2021). What makes you continuously use chatbot services? Evidence from Chinese online travel agencies. Electronic Markets, 31(3), 575–599.
Li, X., & Sung, Y. (2021). Anthropomorphism brings us closer: The mediating role of psychological distance in User–AI assistant interactions. Computers in Human Behavior, 118, 106680. https://doi.org/10.1016/j.chb.2021.106680
Lu, Y., Papagiannidis, S., & Alamanos, E. (2018). Internet of things: A systematic review of the business literature from the user and organisational perspectives. Technological Forecasting and Social Change, 136, 285–297. https://doi.org/10.1016/j.techfore.2018.01.022
Madu, C. N., & Madu, A. A. (2002). Dimensions of e?quality. International Journal of Quality & Reliability Management, 19(3), 246–258.
Mathur, M. B., & Reichling, D. B. (2016). Navigating a social world with robot partners: A quantitative cartography of the Uncanny Valley. Cognition, 146, 22–32. https://doi.org/10.1016/j.cognition.2015.09.008
Meuter, M. L., Bitner, M. J., Ostrom, A. L., & Brown, S. W. (2005). Choosing among alternative service delivery modes: An investigation of customer trial of self-service technologies. Journal of Marketing, 69(2), 61–83.
Meuter, M. L., Ostrom, A. L., Roundtree, R. I., & Bitner, M. J. (2000). Self-service technologies: Understanding customer satisfaction with technology-based service encounters. Journal of Marketing, 64(3), 50–64. https://doi.org/10.1509/jmkg.64.3.50.18024
Meyer-Waarden, L., Pavone, G., Poocharoentou, T., Prayatsup, P., Ratinaud, M., Tison, A., & Torné, S. (2020). How service quality influences customer acceptance and usage of chatbots. Journal of Service Management Research, 4(1), 35–51.
Minge, M., & Thüring, M. (2018). Hedonic and pragmatic halo effects at early stages of user experience. International Journal of Human-Computer Studies, 109, 13–25. https://doi.org/10.1016/j.ijhcs.2017.07.007
Mollen, A., & Wilson, H. (2010). Engagement, telepresence and interactivity in online consumer experience: Reconciling scholastic and managerial perspectives. Journal of Business Research, 63(9–10), 919–925. http://doi.org/10.1016/j.jbusres.2009.05.014
Mozafari, N., Weiger, W. H., & Hammerschmidt, M. (2020). The chatbot disclosure dilemma: Desirable and undesirable effects of disclosing the non-human identity of chatbots [Paper presentation]. In Proceedings of ICIS.
Murtarelli, G., Gregory, A., & Romenti, S. (2021). A conversation-based perspective for shaping ethical human–machine interactions: The particular challenge of chatbots. Journal of Business Research, 129, 927–935. https://doi.org/10.1016/j.jbusres.2020.09.018
Naumann, E., & Giel, K. (1995). Customer satisfaction measurement and management: Using the voice of the customer. Van Nostrand Reinhold.
Parasuraman, A., Zeithaml, V. A., & Berry, L. L. (1985). A conceptual model of service quality and its implications for future research. Journal of Marketing, 49(4), 41–50.
Parasuraman, A., Zeithaml, V. A., & Berry, L. L. (1988). SERVQUAL: A multiple-item scale for measuring consumer perceptions of service quality. Journal of Retailing, 64(1), 12–40.
Parasuraman, A., Zeithaml, V. A., & Malhotra, A. (2005). E-S-QUAL: A multiple-item scale for assessing electronic service quality. Journal of Service Research, 7(3), 213–233.
Patterson, Z., & McEachern, M. G. (2018). Financial service providers: Does it matter if banks don’t behave ethically? International Journal of Consumer Studies, 42(5), 489–500, https://onlinelibrary.wiley.com/doi/10.1111/ijcs.12452
Podsakoff, P. M., MacKenzie, S. B., & Podsakoff, N. P. (2012). Sources of method bias in social science research and recommendations on how to control it. Annual Review of Psychology, 63, 539–569. https://doi.org/10.1146/annurev-psych-120710-100452
Poon, W. C., & Lee, C. K. C. (2012). E-service quality: An empirical investigation. Journal of Asia-Pacific Business, 13(3), 229–262.
Press, G. (2019, October 2). AI stats news: 86% of consumers prefer humans to chatbots. Forbes. https://www.forbes.com/sites/gilpress/2019/10/02/ai-stats-news-86-of-consumers-prefer-to-interact-with-a-human-agent-rather-than-a-chatbot/#394728472d3b
Ranganathan, C., & Ganapathy, S. (2002). Key dimensions of business-to-consumer web sites. Information & Management, 39(6), 457–465.
Rasty, F., Mirghafoori, S. H., Ardekani, S. S., & Ajdari, P. (2020). Trust barriers to online shopping: Investigating and prioritizing trust barriers in an intuitionistic fuzzy environment. International Journal of Consumer Studies, 45(5), 1030–1046. https://onlinelibrary.wiley.com/doi/10.1111/ijcs.12629
Reynolds, N., & Diamantopoulos, A. (1998). The effect of pretest method on error detection rates: Experimental evidence. European Journal of Marketing, 32(5/6), 480–498. https://doi.org/10.1108/03090569810216091
Schweitzer, F., Belk, R., Jordan, W., & Ortner, M. (2019). Servant, friend or master? The relationships users build with voice-controlled smart devices. Journal of Marketing Management, 35(7–8), 693–715.
Seth, N., Deshmukh, S. G., & Vrat, P. (2006). SSQSC: A tool to measure supplier service quality in supply chain. Production Planning & Control, 17(5), 448–463.
Sheth, H. (2019, July 25). How India’s corporates are using chatbots to drive efficiencies. Hindu Business Line. https://www.thehindubusinessline.com/info-tech/how-indias-corporates-are-using-chatbots-to-drive-efficiencies/article28709338.ece
Soderlund, M. (2021). The robot-to-robot service encounter: An examination of the impact of inter-robot warmth. Journal of Services Marketing, 35(9), 15–27. https://doi.org/10.1108/JSM-01-2021-0006
Soderlund, M. (2022). Service robots with (perceived) theory of mind: An examination of humans’ reactions. Journal of Retailing and Consumer Services, 67, 102999. https://doi.org/10.1016/j.jretconser.2022.102999
Solnet, D., Subramony, M., Ford, R. C., Golubovskaya, M., Kang, H. J. A., & Hancer, M. (2019). Leveraging human touch in service interactions: Lessons from hospitality. Journal of Service Management, 30(3), 392–409.
Statista. (2018). Daily time spent on WhatsApp by rural Indians in 2018. https://www.statista.com/statistics/961297/india-daily-time-spent-on-whatsapp-in-rural-areas/#:~:text=As%20per%20the%20results%20of,hours%20daily%20using%20the%20app
Trivedi, J. (2019). Examining the customer experience of using banking chatbots and its impact on brand love: The moderating role of perceived risk. Journal of internet Commerce, 18(1), 91–111.
Troshani, I., Hill, S. R., Sherman, C., & Arthur, D. (2021). Do we trust in AI? Role of anthropomorphism and intelligence. Journal of Computer Information Systems, 61(5), 481–491.
United Nations. (2021). Southern Asia population. https://www.worldometers.info/world-population/southern-asia-population/#:~:text=The%20current%20population%20of%20Southern,of%20the%20total%20world%20population
Wakefield, K. L., & Blodgett, J. G. (1999). Customer response to intangible and tangible service factors. Psychology & Marketing, 16(1), 51–68.
Wamba, S. F., & Queiroz, M. M. (2021). Responsible artificial intelligence as a secret ingredient for digital health: Bibliometric analysis, insights, and research directions. Information Systems Frontiers. Advance online publication. https://doi.org/10.1007/s10796-021-10142-8
Wang, Y.-S., Lin, H.-H., & Luarn, P. (2006). Predicting consumer intention to use mobile service. Information Systems Journal, 16(2), 157–179. https://doi.org/10.1111/j.1365-2575.2006.00213.x
Waytz, A., Cacioppo, J., & Epley, N. (2010). Who sees human? The stability and importance of individual differences in anthropomorphism. Perspectives on Psychological Science, 5(3), 219–232.
Waytz, A., Heafner, J., & Epley, N. (2014). The mind in the machine: Anthropomorphism increases trust in an autonomous vehicle. Journal of Experimental Social Psychology, 52, 113–117. https://doi.org/10.1016/j.jesp.2014.01.005
White, H., & Nteli, F. (2004). Internet banking in the UK: Why are there not more customers? Journal of Financial Services Marketing, 9(1), 49–56.
Wolfinbarger, M., & Gilly, M. C. (2003). eTailQ: Dimensionalizing, measuring and predicting etail quality. Journal of Retailing, 79(3), 183–198.
Wong, I. A., & Fong, V. H. I. (2012). Development and validation of the casino service quality scale: CASERV. International Journal of Hospitality Management, 31(1), 209–217.
Wottrich, V. M., Reijmersdal, E. A. van., & Smit, E. G. (2018). The privacy trade-off for mobile app downloads: The roles of app value, intrusiveness, and privacy concerns. Decision Support Systems, 106, 44–52. https://doi.org/10.1016/j.dss.2017.12.003
Yang, Y., Liu, Y., Lv, X., Ai, J., & Li, Y. (2022). Anthropomorphism and customers’ willingness to use artificial intelligence service agents. Journal of Hospitality Marketing & Management, 31(1), 1–23.
Yarimoglu, E. K. (2014). A review on dimensions of service quality models. Journal of Marketing Management, 2(2), 79–93.
Yen, C., & Chiang, M. C. (2021). Examining the effect of online advertisement cues on human responses using eye-tracking, EEG, and MRI. Behavioural Brain Research, 402, 113128. https://doi.org/10.1016/j.bbr.2021.113128
Yoo, B., & Donthu, N. (2001). Developing and validating a multidimensional consumer-based brand equity scale. Journal of Business Research, 52(1), 1–14.
Yu, E., & Sangiorgi, D. (2018). Service design as an approach to implement the value cocreation perspective in new service development. Journal of Service Research, 21(1), 40–58.
Zeithaml, V. A., Parasuraman, A., & Malhotra, A. (2005). A conceptual framework for understanding e-service quality: Implications for future research and managerial practice. Journal of Service Research, 7, 1–21.
