IIFT International Business and Management Review Journal

 Search

1B. K. School of Professional and Management Studies, Gujarat University, Ahmedabad, Gujarat, India

Creative Commons Non Commercial CC BY-NC: This article is distributed under the terms of the Creative Commons Attribution-NonCommercial 4.0 License (http://www.creativecommons.org/licenses/by-nc/4.0/) which permits non-Commercial use, reproduction and distribution of the work without further permission provided the original work is attributed.
The origin of brands across geographies has always remained a fascination for many consumers around the world. Although easing of restrictions on borders has made almost any brand made anywhere in the world find a convenient place to be sold at any other geographic location far or distant, the craze in some consumers of having an ‘imported’ brand still remains, although that brand may have been manufactured nearby within their country in a franchisee manufacturing unit which the consumer never knows. The phenomenon called as acquiring an ‘imported’ brand has got re-defined with the easing of WTO restrictions since 2001, whereupon there is no restriction on anything sold anywhere after being manufactured anywhere in the world. This article looks into the various aspects related to the consumer buying behaviour for so-called imported or foreign origin brands and to what extent this imported tag or foreignness tag plays a role in making consumers like it.
Brand, origin, consumer, buying, imported, geography
Introduction
Fascination for brands has always been a passion for mankind in this material age, and consumers across geographies and in all ages, genders, societies, classes and professions have many times identified themselves with brands, whereby they consciously project themselves as extensions of these brands. They enjoy their typecasting with certain brands and feel happy by knowing this. These brands are all over across all categories of products whether fast-moving consumer goods (FMCGs), consumer durables or even services. Within these brand-conscious consumers is a sizeable section that is passionate about imported or foreign manufactured brands in all categories of products and services on offer.
Literature Review
Sulhaini (2021) discussed five theories that explain the predisposition of consumers towards foreign products as well as local products and brands. These are theories related to social identity, personal identity, cultural identity, system justification and categorical cognition.
Winit et al. (2014) suggest that perceived brand globalness has a positive impact on evaluations of a brand. Cultivation of a global brand image may be done by companies emphasising global cues. However, local origin allows (global) brands to command a price premium, which may vary across product categories. It seems valuable for local brands to emphasise on globalness. Brand globalness has emerged as a major construct in international marketing. Studying price effects provides additional value which has not received much attention in international marketing. A decent data collection (total N > 800) was done in an understudied but important economy like Thailand.
China continues to attract multinational corporations as a must-win market even after three decades of reforms (Chan et al., 2009). However, intensifying competition in China from more domestic brands remains a challenge. Also, the possibility of a backlash against foreign brands among multinationals has forced them to work on new strategies to grow continuously.
Batra et al. (2000) tried to find out whether consumers in developing countries prefer local brands based on perceived quality and/or social status over brands perceived as having a nonlocal country of origin, particularly from the West. They found that international brand differentiation was greater for consumers who greatly value lifestyles in economically developed countries, consistent with the findings from the literature of cultural anthropology.
Schuiling and Kapferer (2004) studies differences in local brands and competitive advantages in comparison with international brands. They re-analysed the Young & Rubicam database Brand Asset Valuator by examining more than 744 brands in the four largest countries of Europe, the United Kingdom, France, Germany and Italy. They also discussed managerial implications of their findings for international marketers for developing their ideal portfolios of global brands.
Balabanis and Stathopoulou (2019) applied a contrastive perspective in examining identities from social, personal, cultural, system justification and categorical cognition theories as well as their attendant constructs. Consumer xenocentrism, which is a concept rooted in system justification theory, appears to generate predictions more consistent for domestic as well as foreign brand bias.
Momen et al. (2022) found that the local as well as small and medium companies of Bangladesh suffered due to competition from the presence of strong foreign brands in the market. The study aimed to arrive at the factors that influenced predominantly young consumers in purchasing a foreign brand.
Lohan et al. (2021) elaborated that decades after 1990 have seen fast globalisation and technological advancement in many fields including e-commerce, bringing consumers in emerging economies to an array of an earlier unavailable wider range of foreign products and brands. Even though the preference for both domestic and foreign products largely depends on consumer biases, the impact of shared information cannot be underestimated in influencing consumer decision-making. The study aimed primarily in investigating the Indian consumers’ intentions towards foreign apparel brands.
Srivastava (2014) tried to find out how Indian consumers perceive products from China, Taiwan and Hong Kong. They studied factors including types of products purchased, the rationale for their purchase behaviour, whether purchasing Chinese-origin products was affected by variables such as price, utility, quality, image and intention to purchase future products originating in China as well as the relationship between country of origin and the level of consumer satisfaction. The research area was Mumbai, not just the economic capital of India but also a mini-India.
Discussion
Perception of Consumers about Country of Origin
Global marketers know that buyers have distinct attitudes and beliefs about brands and products originating from different countries (Kotler & Keller, 2016). Research demonstrates the ethnocentrism of people, which means their predisposition for products of their own country, unless they are from a less-developed country. Moreover, with a more favourable image of a country, more prominence will come to the label ‘made in that country’. Some countries enjoy reputation for some goods. It is generally perceived that Japan is good for automobiles and consumer electronics and the United States is brilliant in high-tech innovations, soft drinks, jeans, cigarettes and toys. France is always held on a pedestal for luxury goods, perfume and wine.
Passion for Brands
Ever since businesses organised themselves in the form of creating, educating and promoting brands, consumers have always responded in a big way to accept and adopt these brands. It can be safely assumed that organised branding exercises and their acceptance by consumers across the world had systematically occurred since the mid-20th century and has obtained increasing acceptance among consumers for more than seven decades, and it is bound to increase. So strong is the passion for brands that people across cultures, societies, geographies, genders and professions feel proud to associate with brands, and many times merge their identities with that of the brands which they use across all product and service categories. It just does not stop here. Many consumers spread positive word of mouth through their networking about their favourite brands, thereby creating a community around these and feeling happy to regularly participate in such exercises.
Passion for Indian and Imported Brands
As this discussion focuses on the Indian context, the spread of brands in the thought processes of native Indian consumers residing within the geographic boundary of India is emphasised. Brand name and fame carry hugely weigh on the mind and mindset of Indian consumers while buying and using products. The brand may be a physical product brand, a retail outlet or even a service operating within a local area or across the city, or even a national or international brand. Indians are passionate about brands in all product or service categories, and some of them are not even aware whether the brand is national or international as brand promoters also find it useful as long as the brand is firmly etched in Indian consumers' mind. In many FMCG categories, consumers and their generations have been using foreign-origin brands for decades as there was no competition from domestic Indian brands or the competition did not promote their brands vigorously. Brands have become a part and parcel of the lives of all consumers in some form or the other. Whether any consumer is awake or sleeping, the role of brands and dependence on them is very obvious. These brands belong to all types of products or services, viz., toothpaste, shaving cream, nail enamel, nail cutter, nail polish, deodorant, perfume, automobile, mobile phone, laptop, tomato sauce, bread, butter, tissue paper, car rental and so on. Brands have indeed become so important that many consumers cannot imagine their lives without them. In the current times of nuclear family culture, people are living daily more with their brands than with their own family members.
Quality Perception of Imported Brands
Until the 1990s, many Indians would praise and appreciate foreign-origin brands more than Indian-origin brands. When foreign travel was a luxury for many Indians, it was expected from every family member returning from abroad to bring some products of foreign brands for family members in India. The reason was that either the brand was not available in India, or if available, it was not affordable to them due to various duties and taxes. Moreover, these branded products were available in far cities or specialised markets where people were reluctant to travel to buy them. However, since 2010 onwards, with e-commerce becoming a big thing and portals such as Amazon, Flipkart, etc., becoming household names, any brand made anywhere in the world can be accessed, ordered and delivered at the doorstep, and that too at a price less than the one at a physical retail outlet. Moreover, if someone is keen to have it from abroad in dollar or euro denomination, the country-specific website or Amazon app, etc., gives that option too. In other words, e-commerce has made the acquisition of foreign brands easier than ever.
Company Efforts in Highlighting Imported Brands
All foreign-origin brands are promoted by their companies through a systematic combination of all integrated marketing communications tools, viz., advertising, sales promotion, public relations, publicity, event marketing and interactive media. It does not matter whether the foreign brands are imported to India or manufactured within India, but the companies highlight the imported aspect in all their communications, thereby trying to take advantage of all those consumers who get passionate about the word ‘imported’. Such consumers feel more delighted when they acquire these brands at a reasonable price due to their domestic manufacturing, which makes the purchase price of such brands less on account of less cost due to various factors. However, in order to not hurt the sentiments of the people, many manufacturers of such imported brands strategically highlight themselves as domestic brands just as any other home country brand, and some sections of the audience get impressed by such communication. They feel that although the brand is foreign-origin one, it is doing everything which domestic brands do to win their patronage. In other words, many imported or foreign-origin brands play the home-country card to win over audiences who are loyal to home-country brands, putting these foreign brands at par with home-country brands.
Domestic Brands Competing with Imported Brands
In this discussion on foreign and Indian-origin brands, it requires special mention that Indian-origin brands also put their best show highlighting their quality, content, presence, etc., in such a manner that projects them at par and sometimes better than imported brands. In their promotions, these brands are highlighted as having a presence across continents and countries for a long time, thereby making Indian consumers feel that although they use them as their Indian brand, these have an international quality which puts them at par with any imported brand, and sometimes even better than the imported brand. This fact makes consumers respect domestic brands in the same manner as international or imported brands because they believe that domestic brands are also of export quality having a market and recognition in many countries across the world. These domestic brands communicate regularly through their marketing communications about their continued presence and expansion in these foreign countries. It is a win-win situation for the imported brand, domestic export quality brand as well as the consumer who has a choice between the two.
Government Support to Imported Brands
In the interest of money coming into the government treasury for various funding requirements, the government at the central and state levels across the country taxes international companies for spreading their products and brands in India. The more these brands spread and get consumed by Indian consumers, the more taxes come to the government treasury for various forms of public financing through one or the other schemes. Domestic manufacturers also contribute a big way to the tax collection of the government and may be more than the contribution by international manufacturers.
Data
Sampling
Convenience sampling was done and the sample size was 504. It included people of both genders, different ages, students, academics, researchers, working professionals and entrepreneurs. The data was collected using the questionnaire given in the annexure.
Technique
Descriptive Statistics
Statistical analysis of data for following measurements was performed
a. Mean: It is also known as an average of a set of values.
b. Standard error: It gives as to how precise a sample mean is and is calculated by dividing the standard deviation of the sample by the sample size’s square root.
c. Median: The middle value of the given list of data when arranged in an order is the median.
d. Mode: The value that has a higher frequency in a given set of values is the mode.
e. Standard deviation: How dispersed the data are in relation to the mean gives standard deviation.
f. Sample variance: The degree to which the numbers in a list are spread out gives sample variance.
g. Kurtosis: The sharpness of the peak of a frequency–distribution curve is Kurtosis.
h. Skewness: The measure of asymmetry of a distribution is skewness.
i. Range: Measure of the difference between the highest and lowest values is the range.
j. Minimum: The observation with the lowest value.
k. Maximum: The observation with the highest value.
l. Sum: It is the aggregate of all the values or observations in a data set.
m. Count: The number of items or observations in a data set.
In Tables 1–19, the readings are as per the sequence of terms mentioned in the above list from a to m, that is, 13 readings.
Figure 1. Age in years.
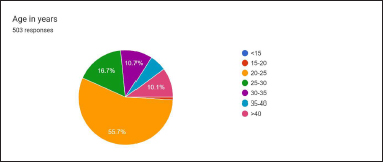
Out of 503 responses, 55.7% belong to the age bracket 20–25 and 16.7% belong to the age bracket 25–30, thereby aggregating a strong 72.4% sample from the 20–30 age range. The remaining were in the 30–35 age group (10.7%), 35–40 age group (5.8%) and above 40 years (10.1%).
Figure 2. Gender.
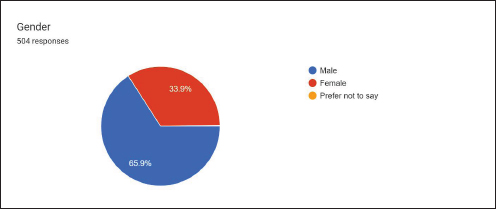
Out of 504 responses, 65.9% were males and 33.9% were females.
Figure 3. Education.

The major portion of the respondents were qualified UG (69%) and PG (23.3%). It shows that most of the sample had higher education: PhD qualified (5.8%) and 12th pass (around 2%).
Figure 4. Occupation.
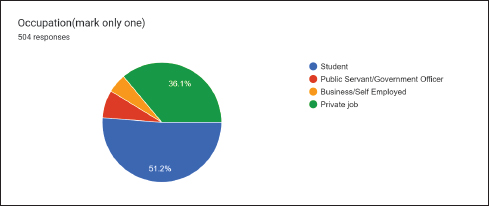
The diagram shows that 51.2% of respondents were students and 36.1% had private jobs. The remaining were business/self-employed (5.2%) and public servant/government officer (7.5%).
Figure 5. Nationality.

It is clear from the above diagram that almost 100% of respondents were Indian.
Figure 6. State of origin.

The diagram clearly shows that 85.3% of respondents are from Gujarat. It consists of respondents from Karnataka (2%), Tamil Nadu (0.2%), Bihar (1%), Jharkhand (0.2%), Uttarakhand (0.4%), Punjab (0.2%), Haryana (0.4%), Jammu and Kashmir (0.4%), Kerala (1.2%), Meghalaya (0.2%), Goa (0.2%), Delhi (0.4%), Rajasthan (3.4%), Madhya Pradesh (1.8%), Maharashtra (1.2%) and Uttar Pradesh (3.2%).
Figure 7. Do you consume imported goods brands?

It is clear from the diagram that a sizeable percentage, that is, 69.2%, of respondents consume imported brands and 30.8% consume domestic brands. In fact, more than double the consumers of domestic brands are the consumers of imported brands.
Figure 8. Quality of imported brands is superior.
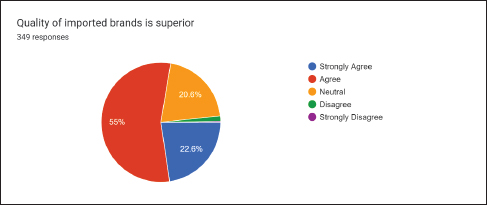
Out of 394 respondents who favour imported brands, 22.6% strongly agree and 55% agree on the superior quality of imported brands, which aggregates to 77.6%. Thus, quality is a big differentiator, which may only be a perception. 20.6% are neutral to the statement, 1.4% disagree, and 0.3% strongly disagree with it.
Figure 9. Imported brands have a certain image which I prefer.

Out of 347 respondents to this question, 15.9% strongly agree and 59.4% agree, which aggregates to 75.3%, projecting a certain superior image of the imported brands guiding these consumers. 18.7% of respondents are neutral to the statement, whereas 6.1% disagree with it.
Figure 10. Imported brands boost my confidence.
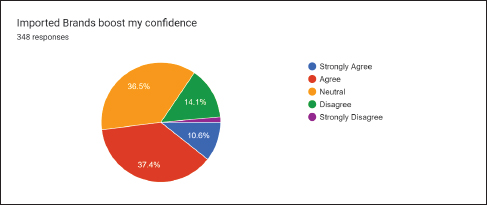
Out of 348 respondents for this statement, 10.6% strongly agreed and 37.4% agreed to it, which aggregates to 48%. In other words, slightly less than half of the respondents relate their confidence to imported brands. However, 36.5% of respondents are neutral to it, which means they do not relate their confidence to any brand. However, 14.1% strongly disagree and 1.4% disagree with this statement.
Figure 11. Imported brands do superior marketing which impresses me.

Out of 348 respondents for this statement, 12.6% strongly agreed and 43.1% agreed, aggregating to 55.7%, which implies that slightly more than half of the respondents are impressed by superior marketing done by imported brands. However, 32.5% of respondents are neutral to this statement. But, 10.3% of respondents disagreed and 1.4% strongly disagreed with it, as they are unimpressed with the so-called superior marketing by imported brands.
Figure 12. I do not prefer domestic brands.
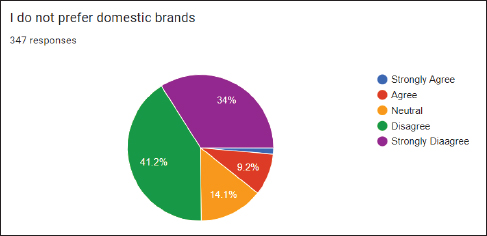
Out of 347 respondents, 34% strongly disagree and 41.2% disagree with the statement. In other words, an overwhelming 75.2% of respondents have no aversion to domestic brands. It is further endorsed by the fact that only 10.6% are agreeing (1.4% strongly agree and 9.2% agree) to not preferring domestic brands. Only 14.1% claim to be neutral or indifferent towards the geographic origin of brands.
Figure 13. I have less faith on domestic brands.
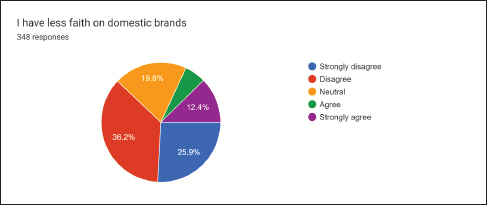
Out of 348 respondents for this statement, 25.9% strongly disagree and 36.2% disagree, aggregating to 62.1%. In other words, a majority of respondents had no less faith on domestic brands. Only 5.7% agree and 12.4% strongly agree. However, 19.8% remain neutral to this statement.
Figure 14. I support Make in India Vision.
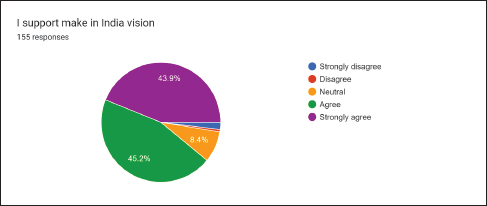
The findings clearly say that out of 155 responses, 43.9% strongly agree and 45.2% agree to supporting the Make in India vision. An overwhelming 89.1% of respondents support this grand vision. Only 8.4% remain neutral to the statement. A very miniscule percentage disagree (0.6%) and strongly disagree (1.9%).
Figure 15. Domestic brands suit me more.

The findings indicate that out of 155 responses, 16.8% strongly agree and 50.3% agree to the idea of domestic brands suiting them more, aggregating to 67.1% of total responses. However, 29.7% are neutral to it, whereas 2.6% disagree and 0.6% strongly disagree to it.
Figure 16. Domestic brands cater better to the needs of Indian consumer.

Out of 155 responses, 18.1% strongly agree and 49.7% agree that domestic brands cater better to the needs of Indian consumers, aggregating to 67.8% of the total responses. 25.8% are neutral to it and 5.2% disagree, whereas 1.3% strongly disagree with it.
Figure 17. Domestic brands have superior quality.

Out of 155 responses, 11% strongly agree and 36.8% agree that domestic brands have superior quality, aggregating to 47.8% of the total responses. However, 38.1% of respondents are neutral to this statement. However, 13.5% disagree with it and only 0.6% strongly disagree with it.
Figure 18. Domestic brands cater better to the needs of Indian consumer.

Out of 155 responses, 18.7% strongly agree and 49.7% agree with this statement, aggregating 68.4% of respondents who believe that domestic brands cater better to their needs as Indian consumers. On the other hand, 25.6% are neutral to this statement, whereas only 6% of respondents do not agree with it (strongly disagree and disagree combined).
Figure 19. Domestic brands are less expensive.

Out of 155 responses, 18.7% strongly agree and 45.8% agree with this statement, aggregating 64.5% of respondents believing that domestic brands are less expensive. However, 28.4% of respondents are neutral to it, whereas 1.3% strongly disagree and 5.8% disagree, aggregating 7.1% as disagreeing with the statement.
Figure 20. Imported brands are very expensive.
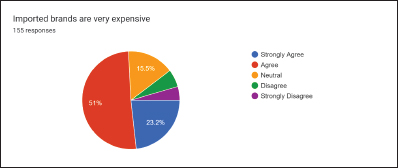
Out of 155 responses, 23.2% strongly agree and 51% agree that imported brands are very expensive, aggregating to 74.2% of the total responses. However, 15.5% are neutral about it and 5.8% disagree with it and 4.5% strongly disagree with it.
Figure 21. I believe that governments support domestic brands in India.

Out of 504 responses, 30.2% strongly agree and 48.8% agree that the government supports domestic brands in India, aggregating 79% of the total responses. However, 14.7% are neutral to it and 3.6% disagree with it, whereas 2.8% strongly disagree with it.
Table 1. Gender.
.jpg/10_1177_jiift_231223566-table1(1)__480x278.jpg)
In Table 1, 1 means male and 2 means female.
Table 2. Age.
.jpg/10_1177_jiift_231223566-table2(1)__480x275.jpg)
In Table 2, 1 implied <15 years, 2 implied 15–20 years, 3 implied 20–25 years, 4 implied 25–30 years, 5 implied 30–35 years, 6 implied 35–40 years and 7 implied > 40 years.
Table 3. Education.
.jpg/10_1177_jiift_231223566-table3(1)__480x279.jpg)
In Table 3, 1 implies 10th pass, 2 is 12th pass, 3 is UG, 4 is PG and 5 implies PhD qualified.
Table 4. Occupation.
.jpg/10_1177_jiift_231223566-table4(1)__480x279.jpg)
In Table 4, 1 means student, 2 means public servant/government officer, 3 means business/self-employed and 4 means private job.
Table 5. Nationality.
.jpg/10_1177_jiift_231223566-table5(1)__480x277.jpg)
In Table 5, 1 means Indian and 2 means non-resident Indian (NRI).
Table 6. Do you Consume Imported Goods/ Brands?
.jpg/10_1177_jiift_231223566-table6(1)__480x275.jpg)
In Table 6, 1 means yes and 2 means no.
Table 7. Quality of Imported Brands is Superior.
.jpg/10_1177_jiift_231223566-table7(1)__480x277.jpg)
In Table 7, 1 is strongly agree, 2 is agree, 3 means neutral, 4 is disagree and 5 implies strongly disagree.
Table 8. Imported Brands have a Certain Image which I Prefer.
.jpg/10_1177_jiift_231223566-table8(1)__480x278.jpg)
Table 9. Imported Brands Boost my Confidence.
.jpg/10_1177_jiift_231223566-table9(1)__480x279.jpg)
In Table 9, 1 implies strongly agree, 2 is agree, 3 means neutral, 4 implies disagree and 5 is strongly disagree.
Table 10. Imported Brands do Superior Marketing which Impresses me.
.jpg/10_1177_jiift_231223566-table10(1)__480x277.jpg)
In Table 10, 1 implies strongly agree, 2 means agree, 3 is neutral, 4 implies disagree and 5 is strongly disagree.
Table 11. I do not Prefer Domestic Brands.
.jpg/10_1177_jiift_231223566-table11(1)__480x279.jpg)
In Table 11, 1 indicates strongly agree, 2 implies agree, 3 is neutral, 4 means disagree and 5 is strongly disagree.
Table 12. I have Less Faith on Domestic Brands.
.jpg/10_1177_jiift_231223566-table12(1)__480x274.jpg)
In Table 12, 1 means strongly agree, 2 implies agree, 3 is neutral, 4 implies disagree and 5 is strongly disagree.
Table 13. I Support the Make in India Vision.
.jpg/10_1177_jiift_231223566-table13(1)__480x279.jpg)
In Table 13, 1 implies strongly disagree, 2 is disagree, 3 implies neutral, 4 is agree and 5 implies strongly agree.
Table 14. Domestic Brands Suit me More.
.jpg/10_1177_jiift_231223566-table14(1)__480x277.jpg)
In Table 14, 1 is strongly disagree, 2 implies disagree, 3 is neutral, 4 implies agree and 5 is strongly agree.
Table 15. Domestic Brands Cater Better to the Needs of Indian Consumer.
.jpg/10_1177_jiift_231223566-table15(1)__480x279.jpg)
In Table 15, 1 is strongly disagree, 2 implies disagree, 3 is neutral, 4 implies agree and 5 is strongly agree.
Table 16. Domestic Brands have Superior Quality.
.jpg/10_1177_jiift_231223566-table16(1)__480x274.jpg)
In Table 16, 1 means strongly disagree, 2 means disagree, 3 implies neutral, 4 is agree and 5 implies strongly agree.
Table 17. Domestic Brands are Less Expensive.
.jpg/10_1177_jiift_231223566-table17(1)__480x276.jpg)
In Table 17, 1 is strongly disagree, 2 implies disagree, 3 is neutral, 4 implies agree and 5 is strongly agree.
Table 18. Imported Brands are Very Expensive.
.jpg/10_1177_jiift_231223566-table18(1)__480x277.jpg)
In Table 18, 1 is strongly agree, 2 implies agree, 3 is neutral, 4 implies disagree and 5 is strongly disagree.
Table 19. I Believe that Governments Support Domestic Brands in India.
.jpg/10_1177_jiift_231223566-table19(1)__480x276.jpg)
Findings
On account of the above simple percentage analysis and descriptive statistics, the following findings can be drawn, which can be subjected to further research:
Limitations of the Study
Annexure
Questionnaire:
Brand origin influence on consumer buying behaviour among Indian consumers.
1. Name

2. Gender
Mark any one.
 Male
Male
Female
Prefer not to say
3. Age
Mark any one.
<15 years
15–20 years
20–25 years
25–30 years
30–35 years
35–40 years
>40 years
4. Education
Mark any one.
Undergraduate
Postgraduate
Doctorate
Doctorate of literature (DLitt)
Other:.png)
5. Occupation
Mark any one.
Student
Public servant/government officer
Business/self-employed
Professional
Employed
Labour
Other:.png)
6. Nationality
Mark any one.
Indian
Non-resident Indian (NRI)
7. State
Mark any one.
Rajasthan
Madhya Pradesh
Maharashtra
Uttar Pradesh
Gujarat
Karnataka
Andhra Pradesh
Odisha
Chhattisgarh
Tamil Nadu
Telangana
Bihar
West Bengal
Arunachal Pradesh
Jharkhand
Assam Ladakh
Himachal Pradesh
Uttarakhand
Punjab
Haryana
Jammu and Kashmir
Kerala
Meghalaya
Manipur
Mizoram
Nagaland
Tripura
Andaman and Nicobar Islands
Sikkim
Goa
Delhi
Dadra and Nagar Haveli and Daman and Diu
Puducherry
Chandigarh
Lakshadweep
8. Do you consume imported goods?
Mark any one.
Yes Skip to question 9
No Skip to question 10
If yes
9. I consume imported goods because? (1) being strongly agree and (5) being strongly disagree
Mark any one in a row.

If /no,
10. I prefer domestic goods over imported goods because? (1) being strongly agree and (5) being strongly disagree
Mark any one in a row

Acknowledgement
I thank Noel Daliwala, PhD Scholar, B.K. School of Professional and Management Studies, Gujarat University, Ahmedabad, Gujarat, for statistical support. I also thank Darshini Dave, PhD Scholar, B.K. School of Psrofessional and Management Studies, Gujarat University, for formatting and layout support.
Declaration of Conflicting Interests
The author declared no potential conflicts of interest with respect to the research, authorship and/or publication of this article.
Funding
The author received no financial support for the research, authorship and/or publication of this article.
Balabanis, G., & Stathopoulou, A. (2019). Favoritism toward foreign and domestic brands: A comparison of different theoretical dexplanations. Journal of International Marketing, 27(2). https://doi.org/10.1177/1069031X198379
Batra, R., Ramaswamy, V., Alden, D. L., Steenkamp, J. B. E. M., & Ramachander, S. (2000). Effects of brand local and nonlocal origin on consumer attitudes in developing countries. Journal of Consumer Psychology, 9(2), 83–95.
Chan, T.-S., Cui, G., & Zhou, N. (2009). Competition between foreign and domestic brands: A study of consumer purchases in China. Journal of Global Marketing, 22(3), 181–197.
Kotler, P., & Keller, K. (2016). Marketing management (15th ed.). Pearson.
Lohan, A., Ganguly, A., Kumar, C., & Talukdar, A. (2021). Foreign product preference among Indian consumers: The role of product reviews, word of mouth and quality of shared information. Journal of Information & Knowledge Management, 20(04), 2150048. https://doi.org/10.1142/S0219649221500489
Momen, M. A., Sultana, S., Ferdousi, F., & Shahriar, S. H. B. (2022). Determinants of choosing a foreign brand in emerging economy: Lessons and implication for the local entrepreneurs. Vilakshan: XIMB Journal of Management, 19 (2), 195–205.
Schuiling, I., & Kapferer, J. N. (2004). Real differences between local and international brands: Strategic implications for international marketers. Journal of International Marketing, 12(4), 97–112.
Srivastava, R. K. (2014). Impact of country of origin on Indian consumers: Study of Chinese brands. Asian Journal of Marketing, 8, 54–70.
Sulhaini, S. (2021). Consumer behavior towards foreign versus local products and brands: Future research directions. Advances in Social Science, Education and Humanities Research, Volume 556 Proceedings of the 2nd Annual Conference on Education and Social Science (ACCESS 2020).
Winit, W., Gregory, G., Cleveland, M., & Verlegh, P. (2012). Global vs. local brands: How home country bias and price differences impact brand evaluations. International Marketing Review, 31(2), 102–128.
