IIFT International Business and Management Review Journal

 Search
1Department of International Business, GITAM School of Business, GITAM (Deemed to be University), Visakhapatnam, Andhra Pradesh, India
2GITAM School of Business, GITAM (Deemed to be University), Visakhapatnam, Andhra Pradesh, India

Creative Commons Non Commercial CC BY-NC: This article is distributed under the terms of the Creative Commons Attribution-NonCommercial 4.0 License (http://www.creativecommons.org/licenses/by-nc/4.0/) which permits non-Commercial use, reproduction and distribution of the work without further permission provided the original work is attributed.
India and the Association of South East Asian Nations (ASEAN) regional grouping had completed three decades of diplomatic relations during this year 2022 and the year has been designated as ASEAN–India Friendship Year. As India initiated its ‘Look East Policy Strategy’ in the year 1991, the trade ties progressed between India and the ASEAN from a sectoral dialogue partnership in 1992 to dialogue and summit-level partnerships during the years 1996 and 2002, respectively. Commemorating, the two decades of India–ASEAN relations the trade ties elevated to the strategic partnership between them during the year 2012. It was in the year 2009 India-ASEAN Free Trade Agreement got signed, and India–ASEAN Services Agreement was signed in the year 2014. ASEAN views India as the most dynamic and trusted partner of East Asia and is keen to accelerate the trade and investment relations with the new Asian tiger. ASEAN also recognises India’s huge trade potential and views it as a strong balancing and stabilising partner in the Asian region. The bilateral trade between the economies has grown exponentially and reached over US$ 79 billion during the year 2020–2021. India’s investment in ASEAN has been growing and reached US$2012 billion during the year 2020, and ASEAN investment has also been growing in India. Despite an impressive trajectory of trade between India and the ASEAN, there is room for further growth through the integration of India into the Asian value chains. In this background, the study would assess the commodity trade patterns between India and ASEAN by observing the extent of India’s trade intensity and revealed comparative advantage (RCA) advantage and trade competitiveness between India and the ASEAN, the stability of these different indices of RCA were tested, in the light of the analysis few policy suggestions were drawn for future trade between India and the ASEAN.
ASEAN, Look East Policy, regional trade, Act East Policy, India, East Asia, Myanmar, ASEAN, Thailand and Singapore
Introduction
India and the Association of South East Asian Nations (ASEAN) are bounded together by their shared culture, history and civilisation. A relation with the ASEAN economies has always been in the forefront of the India’s foreign policy. India and ASEAN relations have passed through a dynamic journey with several achievements to reach the year 2022. India is one of the top trading and investment partner with the ASEAN economies and also both the nations closely cooperate on political and security matters. India’s relationship with the ASEAN has been a key pillar of its foreign policy, and the Indo-Pacific has obtained renewed vibrancy with the signing of Indo-Pacific vision agreements by ASEAN-10 countries and India. The ASEAN–India together form a prominent economic grouping. Today when ASEAN and India are facing common challenges to safeguard their economies from the COVID-19 pandemic, there is a need for stronger multilateral co-operation to contain the post-pandemic challenges and bring back the economy on the growth trajectory. ASEAN–India together constitutes for 30% of the world population, and India remained ASEAN’s largest trade partner as well as FDI investor with $2.1 billion in 2020. ASEAN has emerged as the fifth largest trade partner to India, and the bilateral trade between India and the ASEAN would reach nearly $300 billion by 2025. Despite an impressive trajectory of economic relations between the two nations, still, there is enough room for expanding the trade relations through India’s integration into the value chains of ASEAN. Asia-Pacific region is among the most progressive regions of the globe today, and both ASEAN and India have a central role in shaping the so-called ‘Asian Century’, especially when India entered the ‘Amrit Kal’, after completing the 75 years of independence, and this also completes the India–ASEAN 30 years of dialogue partnership too, with the ASEAN countries. Considering such turn of events, the current article intends to analyse the intensity and potential of India’s trade with the ASEAN trade and assess the future commodity trade potential among identified commodity groups between India and the ASEAN by exploring the complementarities between the two.
Review of the Earlier Literature
Several studies have explored the nature and extent of the trade between India and ASEAN countries and found a greater potential for mutual co-operation and also a larger role of India and ASEAN in the post-COVID-19 geopolitical environment. As deeper integration of India and the ASEAN would help in deriving collective solutions to deal with common challenges and design a common path for resilience (De, 2021). India’s exports to ASEAN have increased by 11x, while total Indian exports have risen only 6x during the past 10 years (2003–2013) and predicts that Indian exports to ASEAN are likely to reach $280 billion by 2023, and India has an advantage in the exports of chemicals, pharmaceuticals, gems and jewellery, iron and steel and other services, whereas ASEAN has advantage in the export of natural resources and electronics projecting the right space for the two-way trade between the countries (Bhogal, 2018). The trade intensity between India and the ASEAN has not only increased but India’s exports to and imports from ASEAN countries have been on rise compared to the total trade pattern with the rest of the world. The values of greater complementarities between exports of India and the ASEAN countries were reflected through the RCA index (revealed the comparative advantage index) presenting larger potential for trade between India and the ASEAN (Raghuramapatruni, 2012). India could actually import many products that are currently being imported from China from the ASEAN countries. By doing so, India can reduce its bilateral trade deficit with China, which can result in an equal trading relation. According to UN data, India currently imports more than 50% of its imports in 36 product categories from China. India needs to find more sources for these products for trade security and also for diversification. India is also heavily dependent on chemical imports from China, which are essential to make fertilisers and these could be replaced with ASEAN markets in the near future (Morgan, 2012). Free Trade Agreements (FTAs) are often signed by the developing economies to improve their balance of payments (BOP) situation but the Regional Comprehensive Economic Partnership Agreement (RCEP) has forecasted to be having an adverse impact on the ASEAN’s countries BOP situation thereby deteriorating the existing BOP situation of the ASEAN economies by 6%. The literature finds that maximum gains of the RCEP would go to Japan, followed by New Zealand. Post RCEP, the BOP situation will worsen for Cambodia, Indonesia, Laos PDR, Malaysia, Myanmar, Philippines, Singapore, Thailand and Vietnam, in this situation, accelerating ASEAN’s trade with India could be seen as a win-win situation for both economies (Banga et al., 2021).
Importance of the Study
The growth in India’s economy is the outcome of the deliberate changes of its approach to economic policy, especially from the 1991 macroeconomic crisis. The country has moved from ‘inward-looking strategy’ to an ‘outward-looking strategy’ and the initiative of its ‘Look East Policy’ has a significant bearing on the integration of its domestic economy with the external world especially the East Asian countries which had resulted in sizeable outcome thereby increasing its trade volumes. India had started its journey of accelerating its reforms through the ‘Look East Policy’. With the success of Look East Policy (1992), country has reincarnated it to Act-East Policy in 2018, to accelerate the economic, strategic and cultural linkages with the ASEAN. In the post-COVID-19 environment when the geopolitical spectrum of the world is completely at change, and countries are looking at near shoring their investments and sourcing intensifying and integrating with the Association of South East ASEAN Nations economies would be beneficial for both India and the ASEAN nations. The earlier literature on India–ASEAN relations also focuses at the importance of more responsible role that could be played by the Asian region and most importantly India and the ASEAN-10. This becomes much more crucial with the 30 years of dialogue partnership of India with the ASEAN neighbours. Such kinds of relations are also important to keep the China factor away for India and also ASEAN to ensure a stable and peaceful Asian region. Hence, identifying the commodity trade potential and complementarity between India and the ASEAN would be useful to assess the future trade potential between them. In this background the current study would be helpful for professionals, practitioners and the business community to understand the growth trajectory of trade between India and the ASEAN of and assess the potential for economic linkages between the two.
Objectives of the Study
Database and Methodology
The researcher employs a combination of descriptive and explorative research design to study the objectives framed. The secondary data sources used for the research are collected from various trade data sites of the World Trade Organization, International Monetary Fund, Asian Development Bank, and United Nations commodity trade data bases. The data are analysed using SPSS and advanced excel tools. The values of correlation for India’s exports and imports were calculated along with the Gravity Coefficient (GC) values to estimate India’s trade with the ASEAN countries. To understand the intensity of trade relations, the export intensity and import intensity of trade between India and the ASEAN were calculated. The export intensity is calculated as a measure of exports of India, exported to the ASEAN partners divided by the total exports of India with the imports of the ASEAN partners from the world divided by the total imports of the ASEAN countries. Similarly, the Import Intensity Index (III) is also calculated as imports of India from the ASEAN divided by the total imports of India with the imports of ASEAN countries with the world to the total imports of the world.
Measuring Revealed Comparative Advantage
The RCA (Balassa, 1979) ‘B’ value is calculated to observe the commodity trade potential. Further the Relative Trade Advantage (RTA) (Vollrath, 1991), comprising the difference between the Relative Export Advantage (RXA) and Relative Import Advantage (RMA) were assessed under the competitiveness:

Further, the second measure as defined by Vollrath is the logarithm of RXA (In RXA) and finally, the RC (Revealed Competitiveness) is calculated by the difference of the logarithms of RXA and RMA. It can be defined that when the indices of RXA and RMA are presented through the logarithmic form they become symmetric through the origin:

A positive value of Vollrath’s 3 measures (RTA, In RXA and RC) reveals a comparative/competitive advantage of the product of the domestic country.
Results and Analysis
Correlation Analysis
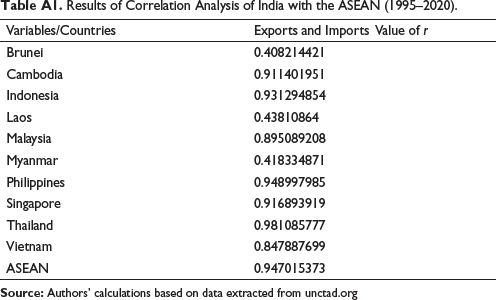
The results of Pearson’s correlation between India’s exports and imports with ASEAN nations present that India’s export–import correlation coefficient (r) with the ASEAN nations registered the significant value of ‘r’ with almost all the eight economies of the ASEAN with respect to export to and imports from them, except in the case of Brunei, Laos and Myanmar (Figure 1, Table A1). However, in the case of the variable total trade and trade balance, the correlation valuation presents a negative correlation with seven of the ASEAN economies, presenting the untapped trade potential of India with the ASEAN nations. The analysis of Philippines presents a higher value of integration with India and with Singapore and Vietnam presenting the nominal positive values.
Intensity Analysis
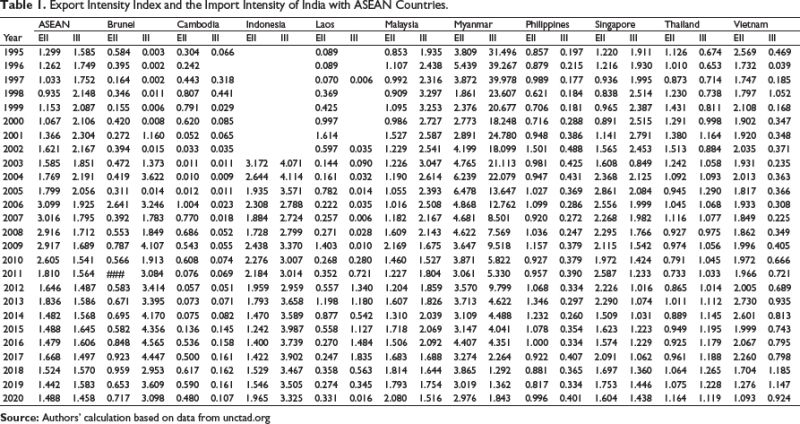
Before making an analysis study on the RCA index to understand the trade potential between the ASEAN economies and India, it would be in the fitness of things to make a careful analysis on the growth of the intensity of trade between the two. According to the ‘natural trading partner theory’ trade between countries who are neighbours and proximity to each other benefit from the FTAs (Krugman & Obstfeld, 2021). Hence, ASEAN countries being closer to India from a distance point of view tend to trade more with their partners. The values of export intensity index (EII) and the III present a greater value of intensity of both export and import relations of India with the ASEAN during the period 1995–2000 (Table 1).
Figure 1. India’s Exports and Imports (Value of ‘r’).
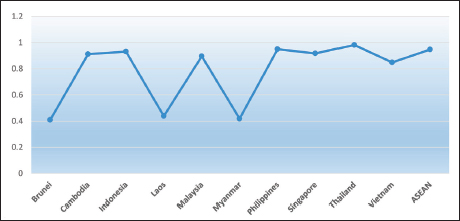
Source: Table A1.
The average values of the EII and III of India with the ASEAN present that among the ASEAN-10, the EII and III average values of India’s export and import potential with Myanmar has been high, where the average EII is at 3.867 for the whole period and average III stood at 13.714, the geographical proximity of the nation with India and sharing the same land border are some of the reasons of growing proximity of trade between the two. This is followed by Malaysia with an average EII value at 1.367 and average III value at 2.210, in the whole period of study, the values of EII & III of India and Malaysia were higher than 1, which has been an important trade partner to India, who has an FTA with India. Singapore is also among the top-10 trade partners with India and a major entrepot hub, the average EII (1.760) value and III (1.707) value have been greater than 1 for the whole period. India has an FTA with Singapore. Thailand also registered values higher than 1 on an average for the whole period, with EII value at 1.062 and III value at 1.030. The average EII of the Philippines has been closer to 1 at 0.985, the III is at 0.322. In the case of Laos and Cambodia both, the average intensity index values have been low, EII and III of Laos were at 0.492 and 0.484, respectively, and of Cambodia were at 0.387 and 0.098, respectively. The export bank of India (EXIM bank) also adopted the Cambodia, Laos, Myanmar, Vietnam (CLMV) strategy towards accelerating the trade with the countries of Cambodia, Laos, Myanmar and Vietnam and to encourage the prospective traders in India to trade with the ASEAN neighbours, which could enhance the trade value between them.
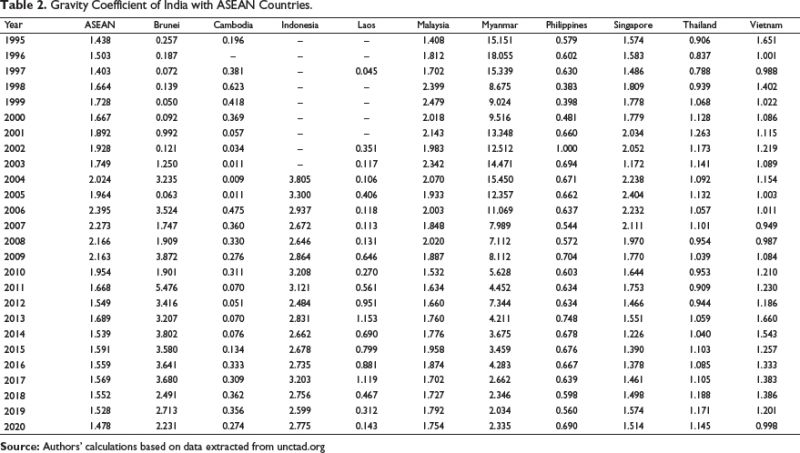
Gravity Coefficient Analysis
To further understand gravity of trade between India and the ASEAN region, The GC values for the period of 1995–2020 were analysed to observe the trade dependency situation between them. The values of GC (Table 2) present a greater degree of trade gravity between India and the ASEAN nations during the period of study. The GC value for the whole period (1995–2020) presents a greater than one presents a higher trade integration of India with the ASEAN-10 nations. The average GC value for the entire period of India and the ASEAN is at 1.755 presenting higher integration of the trade among them. Among the countries taken for the study, the GC value between India and Myanmar is the highest with a two-digit value registered for total 9 years, these values reconfirm greater trade integration of India and Myanmar and further this potential can be tapped between the two, the average GC value is at 8.429. Indonesia registered the average GC values at 2.899 followed by Brunei where the average for the period 1995–2020 is at 2.063. Thailand and Vietnam also have presented greater gravity of trade integration with India with average GC values higher than one. Among the ASEAN-10, Philippines (0.629 average GC value), Laos (0.419 GC value) and Cambodia (0.239 GC value) have been low.
Revealed Comparative Advantage of India with ASEAN-10
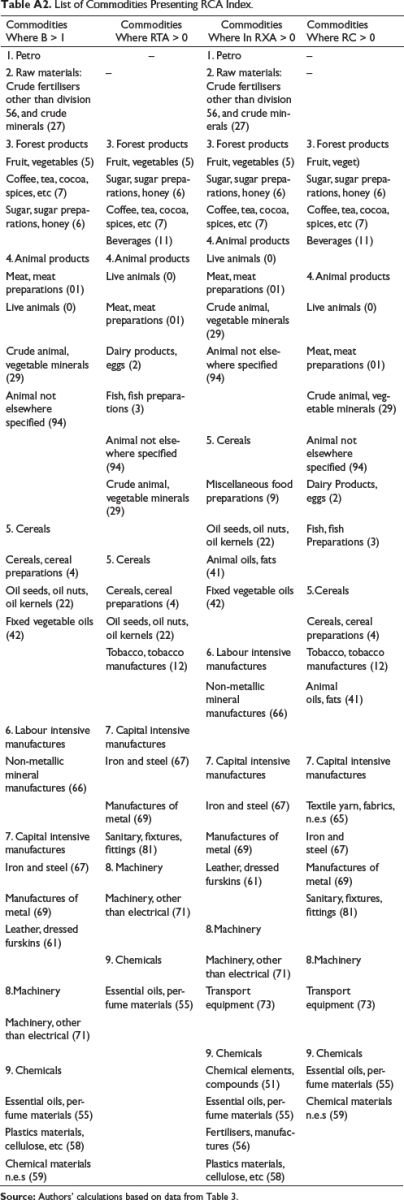
The various RCA indices as presented in the research methodology computed for India’s trade with ASEAN economies for a period 2016–2020, for commodities belonging to 10 categories and 50 products at Standard International Trade Classification-3 (SITC-3), following the Lemer’s Aggregation scheme, from the data extracted from the Unctad database (Table 3) (see Table A2 and Table A3).
The mean and the CV from the summary statistics of the 4 RCA indices—B (Balassa Index, RTA, RXA, and RMA are calculated that present a similar pattern, with all the four revealing a comparative advantage: B; for 23 distinct products (Table A2) classified under the 10 distinct categories. The RXA index of ‘B’ could be observed with respect to all the 10 distinct commodity groups. Under the classification of petro, 1 commodity, raw materials, 1 product, 3 products under the forest product group, followed by 4 commodities under the animal product group, 3 products under cereals group classification, 2 under the labour intensive classification, cap intensive products, 3 and 2 in machinery classifications, respectively. Under the chemicals group, the ‘B’ value presents the largest number of products with RCA (4 commodities) where India’s Relative Export Advantage (REA) has been greater than 1. This is quite evident that over a period India’s commodity export basket has shifted from offering low technological labour-intensive commodity exports to high-end, technological manufacturing sector goods.
The Relative Trade Advantage (RTA), which also takes Revealed Import Advantage (RMA) into consideration, finds that RTA could be observed in 17 commodities (Table A2), where the RTA value > 0. A list of 4 commodities under the forest product group, 5 commodities under the animal product group, 3 under the cereals category, 3 under the capital intensive category, 1 under the machinery group and 1 under the chemicals category could be found to have RTA. These products could provide a major export potential for India and the ASEAN countries trading with each other. As the RTA observed, India’s trade potential is in tune with the import requirements of the ASEAN-10 (see Table A3).
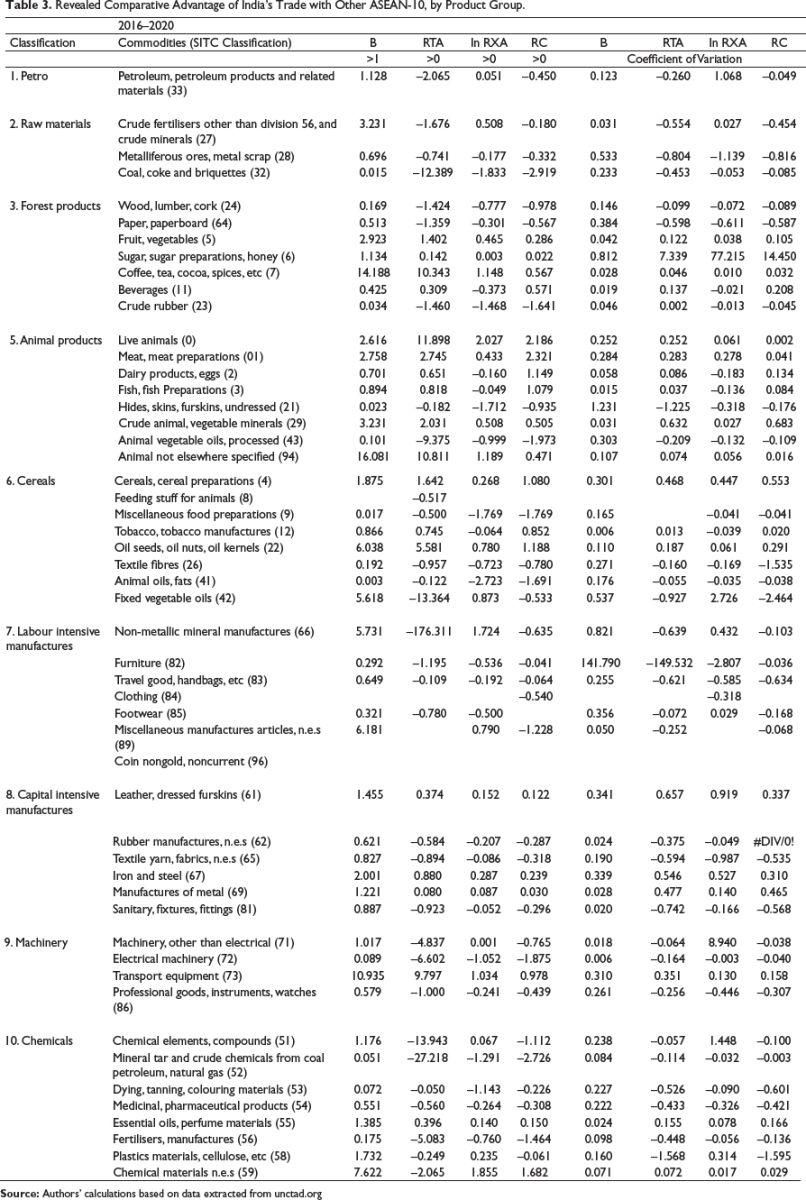
A total of 21 commodities present have shown In RXA values greater than 0 present India’s greater integration with the ASEAN-10. (Table A3). The value of In RXA could be observed in 1 product under petro, 1 for raw material sector, 3 commodities under the forest product group, 4 commodities under the animal product group, 2 under the cereals category, 1 under the labour intensive category, 3 under the capital intensive category, 2 under the machinery group and also 4 under the chemicals category could be found to be having significant value of log RXA, which is >0. In total, 19 commodities were present in the RC, where the RC > 0 (Table 3). The RC could be observed in 4 commodities under the forest product group, 6 commodities under the animal product group, 3 under the cereals category, 3 under the capital intensive category, 1 under the machinery group and 2 under the chemicals category could be found to be having significant RC values. The low CV values for all the product groups present the indices that were fairly stable during the period taken for study and across all the RCA variables (see Table A3). This presents the commodity trade potential of the ASEAN-10 economies and huge untapped potential that could be carefully channelised to cater the needs of the region towards achieving millennium development goals and accelerate the economic growth of India and the ASEAN as a whole.
Consistency Test of the Indices
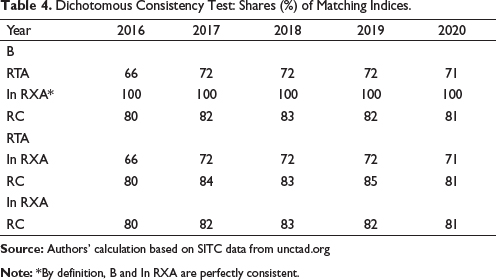
The consistency and the dichotomous measures are used to reveal the stability of the above RCA values calculated. The correlation coefficient between the pair of indices of each of RCA for the 5 years is calculated as a cardinal measure of RCA. Out of the possible 6 pairs, 2 pairs (the B and the RTA) and (the InRXA and the RC) were shown to have a higher degree of correlation value which is >=0.72. This explains that the indices are not consistent as a cardinal measure of RCA. The ordinal measures for the consistency test are calculated by taking the rank correlation coefficients of the RCA pairs, 6 pairings of the indices * 5 years taken for the study, presenting more consistency with 24 pairs out of 30 correlation coefficients, which were >0.72. The dichotomous measure reveals that all four indices, with 26 pairs out of the 30 pairs taken for study, were fairly consistent with >70% (Table 4).
These simple tests confirm that the indices are less consistent as cardinal measures, in accordance with the findings of Balassa. However, the results obtained from these test confirm and offer with the results and offer more support for the use of the indices as binary measures of comparative advantage. Hence, we can conclude that the RCA index measures are useful proxies in determining whether or not India has a comparative advantage in a particular product group or not, though they might not be indicating the extent of such type of comparative advantage.
Stability of Revealed Comparative Advantage
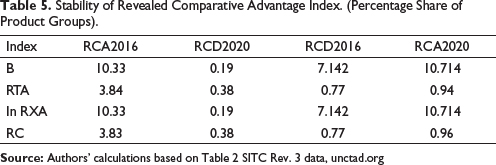
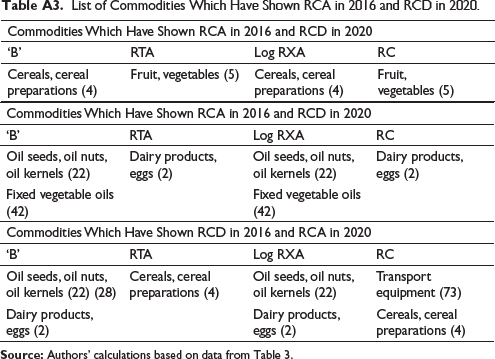
To further understand the stability of the RCA values during the period 2016–2020, the various measures of stability are applied to the results of the RCA indices. The percentages of the products groups were calculated, which have RCA during the year ‘2016’ but seem to have an Revealed Comparative Disadvantage (RCD) during the period ‘2020’. In addition, similarly, the percentages of the product groups that seem to have RCD in the year ‘2016’ but an RCA during the year ‘2020’ (Hoekman & Djankov, 1997). The product groups after analysis present that India had an RCA during the year 2016 but presents an RCD in 2020, such products accounted between 1% and 10% of the total value of the commodity trade during the period 2016 and less than 1% in 2020. Such products, which reveal an opposite situation, that is, an RCD during the year 2016 but an RCA by the year 2020, were comparatively little higher, which makes up between 7 and 10% (see Table 5), presenting not much change in the RCA during the period of the study. The final values of the ‘B’ and In RXA are usually identical as their perfect match that could be obtained under the dichotomous consistency test.
Distribution of the ‘B’ Value
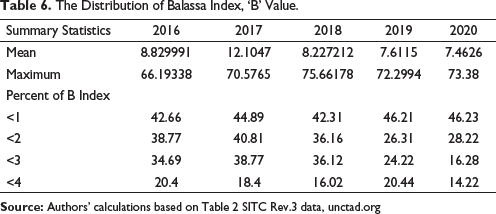
The changes in the distribution of the ‘B’ Balassa values (Table 6) over the period, as suggested by Hinloopen and Marrewijk (2001), reveals India’s RCA has been consistent with the ASEAN economies—the mean value calculated during the period 2016 is 8.829 this had registered at 8.227 during the period 2018 and after that there was a slight decline to 7.46 during the period 2020. The maximum value also gradually increased from 66.19 from the year 2016 to 73.38 by the year 2020. In the year 2016, 42.66% of the ‘B’ values were greater than 1 and this gradually increased to 46.23 during the year 2020, and 38.77% of the ‘B’ registered greater than 2 and this halved to 28.22 during the end of the year 2020. In addition, 34.69 of the ‘B’ values could be found to have value which is greater than 3, this gradually declined to 16.28% in the year 2020. The products with ‘B’ values which were >4 were 20% in the year 2016 and this significantly reduced to 14% by the end of the period of the study. This presents that the distribution of ‘B’ value over the period was largely consistent during the whole period of the study.
Conclusion
India’s RCA with the ASEAN is presented for 23 distinct commodity groups taken for the study. This reveals the potential for India’s trade with the ASEAN and the presence of complementarity in the product category. The analysis of the stability index and the Coefficient of Variation values also presents a fairly stable situation of the commodity category taken for the study. The revealed trade potential can be taken to tap the untapped trade potential with the ASEAN partners. ASEAN has been one of the four among the focus regions for India. Sharing the same culture and rituals, the eastern part of India has been the gateway for trade with the ASEAN countries. India shares maritime borders with Indonesia and Thailand and a land border with Myanmar. With the strengthening of infrastructure and logistics in the Eastern states, the trade potential with the ASEAN partners can be accelerated. India and ASEAN has signed some important agreements as Comprehensive Economic Cooperation Agreement in 2010 with the ASEAN, where both the regions agreed to reduce and eliminate duties from both sides significantly on 76.5% of goods and liberate the tariffs for more than 90% of goods, trade has increased for exports for over 23% and imports by 55% during the past decade. Similarly, India–Singapore FTA, India–Malaysia FTA and India–Thailand Early Harvest Scheme have all acted towards integrating India’s trade with the ASEAN partners. The analysis from the current study also confirms a growing intensity of India’s trade with the ASEAN partners.
After nearly 8 years of negotiations, the 15 Asia-Pacific economies such as Japan, China, South Korea, Australia, New Zealand and the ASEAN have concluded the world’s largest FTA the ‘RCEP’ during 2020. India, which was one of the major economies and part of major negotiations for RCEP, chooses to stay away from the RCEP agreement. The major reasons are to protect the domestic industries and correct the deficit situation with the majority of the RCEP countries. Also, India is the only Asian economy to be a part of South Asian Free Trade Area and has an FTA with the ASEAN economies too, India would have been the gateway for the rest of the RCEP countries in the South Asian region through this agreement. With the increasing competitiveness of the Indian exports and growth in the manufacturing sector, and right initiatives of ‘Atmanirbhar’ and ‘Make in India’ programmes along with significant agreements with the ASEAN group the complete potential of India–ASEAN India trade could be achieved in the near future, when India–ASEAN completing 30 years of their integration and India is celebrating its ‘Azadi ka Amrit Mahotsav’.
Appendix A
List of Abbreviations
B: Balassa’s Index
RC: Revealed Competitiveness
RCA: Revealed Comparative Advantage
RTA: Relative Trade Advantage
REA: Relative Export Advantage
RCD: Revealed Comparative Disadvantage
BIMSTEC: Bay of Bengal Initiative for Multi-Sectoral Technical Economic Co-operation
ASEAN: Association of South East Asian Nations
RCEP: Regional Comprehensive Economic Partnership Agreement
Declaration of Conflicting Interests
The authors declared no potential conflicts of interest with respect to the research, authorship and/or publication of this article.
Funding
The authors received no financial support for the research, authorship and/or publication of this article.
Balassa, B. (1979). The changing pattern of comparative advantage in manufactured goods. Review of Economics and Statistics and Statistics, 61(2), 259–266. https://www.jstor.org/stable/1924594?seq=7
Banga, R., Gallangher, K. P., & Sharma, P. (2021). Regional Comprehensive Co-operation Agreement: Goods market access implications for ASEAN [Working Paper No. 045/3/2021]. Boston University, Global Development Centre. https://www.bu.edu/gdp/files/2021/03/GEGI_WP_045_FIN.pdf
Bhogal, P. (2018). India ASEAN economic relations: Examining future possibilities [Issue Brief 221]. Observer Research Foundation. https://www.orfonline.org/wp-content/uploads/2018/01/ORF_Issue_Brief_221_India_ASEAN.pdf
Hinloopen, J., & Marrewijk, C. van. (2001). On the empirical distribution of the Balassa index. Weltwirtschaftliches Archiv, 137, 1–35. http://doi.org/10.1007/BF02707598
Hoekman, B., & Djankov, S. (1997). Determinants of the export structure of countries in Central and Eastern Europe. World Bank Economic Review, 11(3), 471–487. https://documents1.worldbank.org/curated/ru/415691468251106363/pdf/772520JRN0WBER0Box0377301B00PUBLIC0.pdf
Krugman, P., & Obstfeld, M. (2021). International economics: Theory and policy. Pearson Publishers. https://www.pearson.com/en-us/subject-catalog/p/international-economics-theory-and-policy/P200000005956/9780137465699
Morgan, D. J. (2012, 14 December). From China to ASEAN: Rebalancing India’s trade. Gateway House: Indian Council on Global Relations. https://www.gatewayhouse.in/china-asean-rebalancing-indias-trade/https://www.routledge.com/Corporate-Links-And-Foreign-Direct-Investment-In-Asia-And-The-Pacific/Chen-Drysdale-Davidson-Siemensen/p/book/9780813389738
Raghuramapatruni, R. (2012). India’s trade with the ASEAN. Abhijeet Publications. https://www.researchgate.net/publication/321671648_India's_Trade_with_the_ASEAN
Vollrath, T. (1991). A theoretical evaluation of alternative trade intensity measures of revealed comparative advantage. Review of World Economics, 127, 265–280. https://www.scirp.org/(S(i43dyn45teexjx455qlt3d2q))/reference/ReferencesPapers.aspx?ReferenceID=1152675
