IIFT International Business and Management Review Journal

 Search
Subir Mitra1 
1Indian Institute of Foreign Trade, Gandhinagar, Gujarat, India

Creative Commons Non Commercial CC BY-NC: This article is distributed under the terms of the Creative Commons Attribution-NonCommercial 4.0 License (http://www.creativecommons.org/licenses/by-nc/4.0/) which permits non-Commercial use, reproduction and distribution of the work without further permission provided the original work is attributed.
The dairy supply chain encompasses a complex network of stakeholders, including milk producers, processors, distributors and retailers. Effective management of this supply chain is essential for ensuring the continuous supply of high-quality milk and milk products to consumers. Milk suppliers, as the primary source of milk, play a critical role in the dairy supply chain. Understanding and segmenting milk suppliers based on their milk-supplying behaviour can provide dairy organisations with valuable insights for optimising supply chain management strategies. It will also improve supplier relationships and enhance overall profitability. At present, all transactions of individual milk suppliers are digitally recorded immediately at the point of their supply on a daily basis, creating a massive database that can be used for dynamic data analysis by fast computing facilities available in information technology today. Recency frequency monetary (RFM) analysis is a powerful tool that can be used to segment milk suppliers based on their milk-supplying behaviour. Further, based upon the initial RFM analysis, machine learning-based algorithms may be utilised to give interesting insights into the supply patterns, which may be missed by normal statistical analysis. This article explores the benefits of RFM application for segmenting milk suppliers of a dairy organisation for managing the supply chain effectively with a real case example.
Recency frequency monetary analysis
Introduction
Milk procurement in a typical village in India is essentially a bulking operation, as an average milk supplier supplies only about 2–5 L of milk a day, and hence there is a need for a multitude of suppliers for a viable operation. However, keeping physical track of the supply behaviour of thousands of such suppliers over a period of time becomes a herculean task for the milk procurement managers, especially when the area of operations spans across more than three to five districts and the milk suppliers supply milk twice a day.
To put it in perspective with an example, an organisation procuring an average of 2 lakh litres of milk per day may have around 40,000 milk suppliers dispersed widely in 400 villages with a geographically spread across 3000 sq. km. Assuming two milk-supplying transactions per day per milk supplier, wherein the quantity and quality of milk supplied, as well as the value of milk received is recorded, we have a database of around 3 crore records or transactions in a single year. (However, with today’s fast computing facilities, we can analyse the last 5 years of data with maybe 15 crore records within seconds for all these thousands of milk suppliers along with their seasonal or sporadic variations.)
Adding to the complexity of the milk supply chain is that not all suppliers supply milk every day. There may be suppliers who are leaving or joining depending upon the season (milk supply is strongly seasonal and also impacted by vagaries of weather conditions) or competition due to the availability of better prices and/or facilities provided by other players. Further, new animals may have been inducted or some animals may be dry in the supplier household. Given that milk suppliers in India are mostly smallholder farmers residing in the villages, the changing economic condition of the supplier households also plays an important part in their milk-supplying behaviour. For an effective supply chain management, the milk procurement managers need to be constantly aware of the reasons behind the increase or decrease in milk supplies.
Supplier Segmentation and Recency Frequency Monetary Analysis
Milk suppliers are the backbone of the dairy industry, providing the raw material for milk production. Their performance directly impacts the quality and quantity of milk produced, which in turn affects the dairy organisation’s ability to meet market demand and achieve its financial goals. Thus, effective segmentation of milk suppliers can help dairy organisations in the following ways:
In fact, supplier segmentation, which is a strategic approach to grouping suppliers based on shared characteristics, has now emerged as a valuable tool for dairy organisations to enhance supplier relationships and drive profitability.
Among the various supplier segmentation techniques, RFM analysis has gained prominence due to its simplicity and effectiveness.
RFM analysis classifies suppliers based on three key dimensions:
Database and Methodology Used for the Study
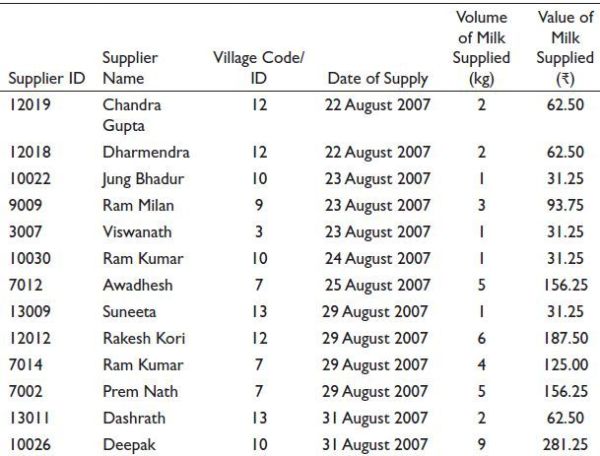
Daily milk transaction data for 1,564 milk suppliers residing in 15 nearby villages for a milk chilling centre in Uttar Pradesh were collected between the period August 2007 and July 2009. The transaction data consisted of ‘Supplier’s Name/ID’, ‘Village Code/ID’, ‘Date of supply’, ‘Volume of milk (kg)’ supplied and ‘Value of milk supplied (Rs)’ for each of their daily transactions during this period.
Some records for understanding of the database are as shown in Table 1.
The application software for RFM analysis was developed in Python (though it can also be done very easily in Excel and utilised if the volume of data is not very big).
To calculate Recency, we subtracted the last supply date from the current date and extracted the number of days using the datetime.now().date() function of Python. It gives us the number of days since the supplier’s last supply, representing their recency value.
After that, we calculated the Frequency for each supplier. We grouped the data by ‘Supplier Name/ID’ and counted the number of unique ‘Date of Supply’ values to determine the number of supplies made by each supplier. It gives us the frequency value, representing the total number of supplies made by each supplier.
Finally, we calculated the Monetary/Volume value for each supplier. We grouped the data by ‘Supplier Name/ID’ and summed the ‘Volume of Milk Supplied’ values to calculate the total amount of milk supplied by each supplier. This could also have been done using the monetary value of the milk supplied but in our context, when this information needs to be used by the procurement manager, it is more apt to provide it in terms of volume. It gives us the Monetary/Volume value, representing the total monetary/volume contribution of each supplier.
By performing these calculations, we now have the necessary RFM values (recency, frequency, monetary/volume value) for each supplier, which are important indicators for understanding supplier behaviour and segmentation in RFM analysis.
Table 1. Sample Transaction Records.
We assigned scores from 5 to 1 to calculate the Recency score, where a higher score indicates a more recent supply. It means that suppliers who have supplied more recently will receive higher recency scores.
We assigned scores from 1 to 5 to calculate the Frequency score, where a higher score indicates a higher supply frequency. Suppliers who made more frequent supplies will receive higher frequency scores.
To calculate the Monetary score, we assigned scores from 1 to 5, where a higher score indicates a higher Volume supplied by the customer.
To calculate RFM scores, we used the pd.cut() function of Python to divide recency, frequency and monetary values into bins. We define five bins for each value and assign the corresponding scores to each bin.
This is illustrated with an analysis of some sample suppliers in Table 2.
For instance, a supplier with a recent supply, high supplying frequency and very significant monetary value or volume of milk supplied would receive high scores, namely 555 across all three dimensions, placing them in a segment of high-value, loyal suppliers, while the worst supplier may be scored as 111.
Results
It may be noted that not all suppliers supplied milk every day in this period. Further, along with the fluctuation of the quantity of milk supplied by the suppliers in this period, there were many incidents of old suppliers leaving and/or new suppliers joining for some reason during this period. This dynamic characteristic of the milk supply chain is quite expected and is inherent in the milk supply chain, which makes the milk procurement activity very challenging. In fact, this is true of most of the rural produce in our country in bulking small holder production.
Table 2. Recency Frequency Monetary (RFM) Score of Sample Suppliers.
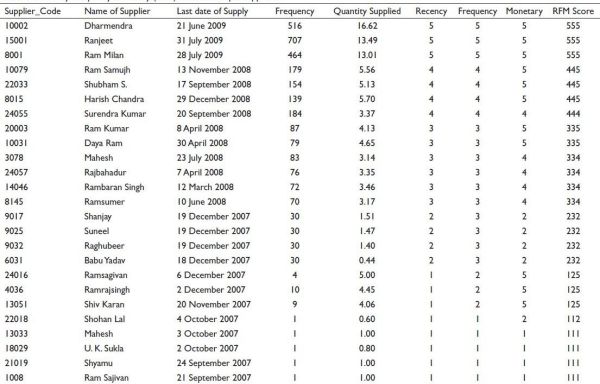
Figure 1. Dynamic Changes in Milk Procurement Volume and Milk Suppliers Over Time.
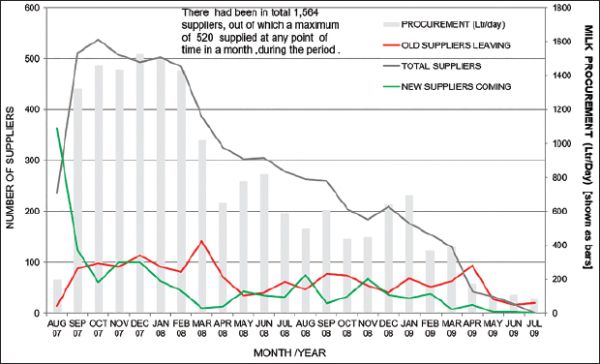
The dynamic changes in milk procurement volume and the number of milk suppliers supplying milk in each month during the period can be illustrated by a graphical analysis of the data as shown in Figure 1.
It can be seen that the total milk procurement volume was growing and reached a high of around 1,500 L/day (converted from kg to L) in December 2007. However, after that, the volume started shrinking as more suppliers started leaving as compared to new suppliers joining the organisation. It was also observed that out of the total of 1,564 suppliers who got enrolled, there was a maximum of 520 suppliers who had supplied milk at any point in time (October 2007).
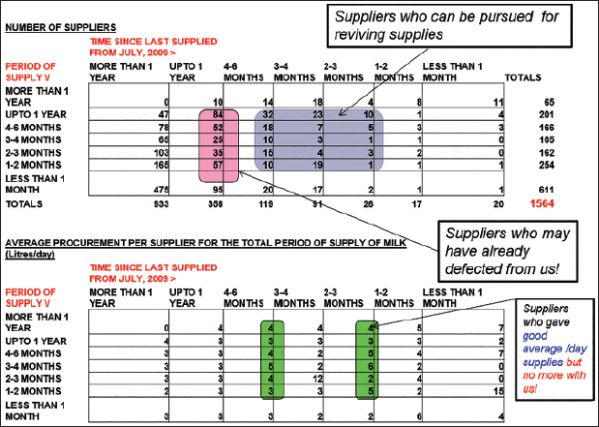
To get more useful insights in supply patterns, we segmented the suppliers by creating a two-dimensional table as shown in Figure 2, wherein their recency (time since last supplied in months/year) was mapped with their total period of supply (in months/years) during this duration, as shown in Figure 2.
It can be seen that at the end of the duration, we had only 20 suppliers left in the last month. Further, 236 suppliers had left in the last 6 months prior to it, out of which 65 suppliers had been supplying regularly for one year before leaving. Many of them were supplying around 3–6 L/day. These suppliers could have been incentivised to stay with the organisation.
Figure 2. Mapping Recency with Duration of Supplies.
Using the RFM Scores for Segmentation
RFM scores obtained after analysing the data (as shown earlier) for each supplier can be used to categorise suppliers into different segments. It can be seen that this score may vary from 555 for the best suppliers to 111 for the worst suppliers. We can also create further groups by combining these segments as per our strategic requirements for enhancing milk supply, as shown in Figure 3.
For instance, if our strategy is to focus on highly regular milk suppliers who stay with us, having high to average supply volumes, then we may combine RFM scores with R = 5,4,3 and F = 5,4,3 and M = 5,4,3 and make Category ‘A’ suppliers. Further, we may combine to get another Category ‘B’ suppliers having very low volume of milk supply but otherwise regular and staying with us with R = 5,4 and F = 5,4 and M = 2,1. The remaining suppliers may be categorised as Category ‘C’, who are mainly irregular, floating suppliers looking for arbitrage opportunities and unlikely to be dependable in future. As a strategy, we may need to develop Category ‘A’ with 351 suppliers and Category ‘B’ with 96 suppliers with proper incentives and maintain live relations for our steady milk supply instead of spreading our effort thinly over a large number of suppliers. Category ‘C’ has 1,117 suppliers who may not be dependable for a steady milk supply.
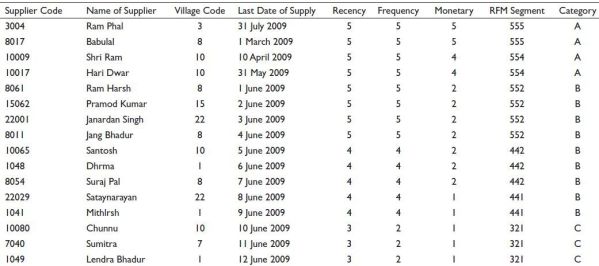
This is illustrated with analysis of some sample suppliers, as shown in Table 3.
Figure 3. Categorisation of Suppliers After Segmentation.
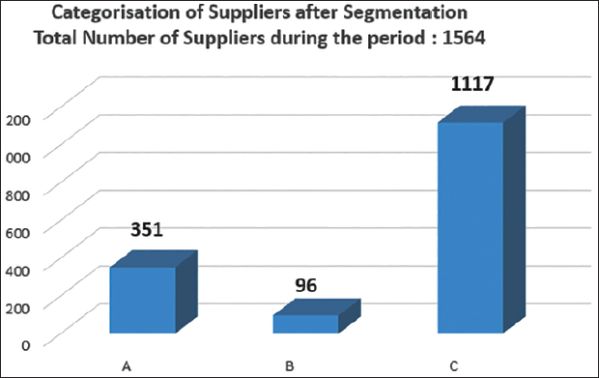
Note: Total number of suppliers during the period: 1,564.
You may observe that if timely action was taken in segmenting and categorising milk suppliers by observing the data (which was always available), it could have averted the milk procurement crisis happening within a mere 2 years (August 2007 to July 2009) start of this newly opened milk chilling centre.
The findings of RFM analysis may be disseminated to the village supervisors and field officers engaged in milk procurement operations, as below:
At present, all milk supply points have the necessary computer facilities that capture everyday milk transactions from each supplier, which can be profitably utilised for creating this RFM on a regular basis for discussion among the field officers and village supervisors.
Benefits of RFM Segmentation for Milk Suppliers
RFM segmentation offers several benefits for dairy organisations in the context of milk procurement:
Table 3. Profile of Sample Suppliers After Categorisation and Building Recency Frequency Monetary (RFM) Scores.
Conclusion
RFM analysis is a valuable tool for segmenting milk suppliers and optimising procurement strategies in the dairy industry. By understanding the supply behaviours of their milk suppliers, dairy organisations can make informed decisions about resource allocation, supplier engagement, pricing and risk management. Effective segmentation can lead to improved supplier relationships, reduced costs and increased profitability for dairy organisations.
Declaration of Conflicting Interests
The author declared no potential conflicts of interest with respect to the research, authorship and/or publication of this article.
Funding
The author received no financial support for the research, authorship and/or publication of this article.
ORCID iD
Subir Mitra https://orcid.org/0009-0003-1965-5832
